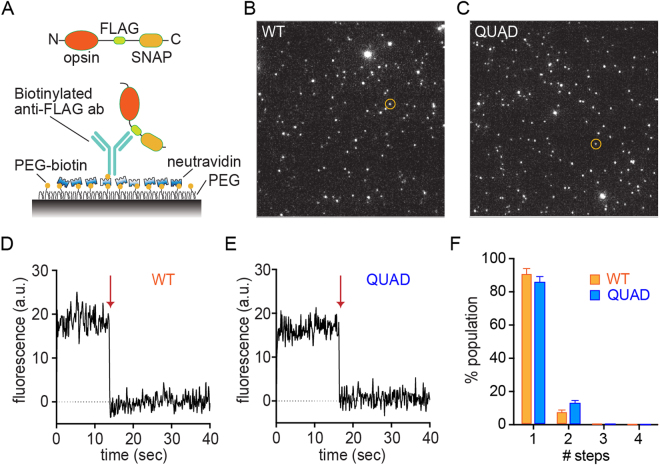
Figure 4.
Single molecule fluorescence measurements reveal that purified WT and Quad opsins are monomers. (A) Schematic illustration of the single molecule pulldown (SiMPull) set up. (B) Representative TIRF image of SNAP-surface 549-labeled WT opsin-FLAG-SNAP; the circled spot corresponds to the photobleaching trace in panel D. (C) Representative TIRF image of SNAP-surface 549-labeled QUAD opsin-FLAG-SNAP; the circled spot corresponds to the photobleaching trace in panel E. (D) Trace depicting 1-step photobleaching of the circled spot from panel B when exposed to a 561-nm laser beam at time 0 s. The arrow depicts the point at which photobleaching occurred. (E) Trace depicting 1-step photobleaching of the circled spot from panel C when exposed to a 561-nm laser beam at time 0 s. The arrow depicts the point at which photobleaching occurred. (F) Fraction of the total population of spots that show 1-, 2-, 3-, or 4-step photobleaching (1102 and 1083 spots were analyzed for WT and QUAD opsin constructs, respectively). Error bars indicate standard errors calculated from 5 movies for each condition (169–257 spots were analyzed per movie).

