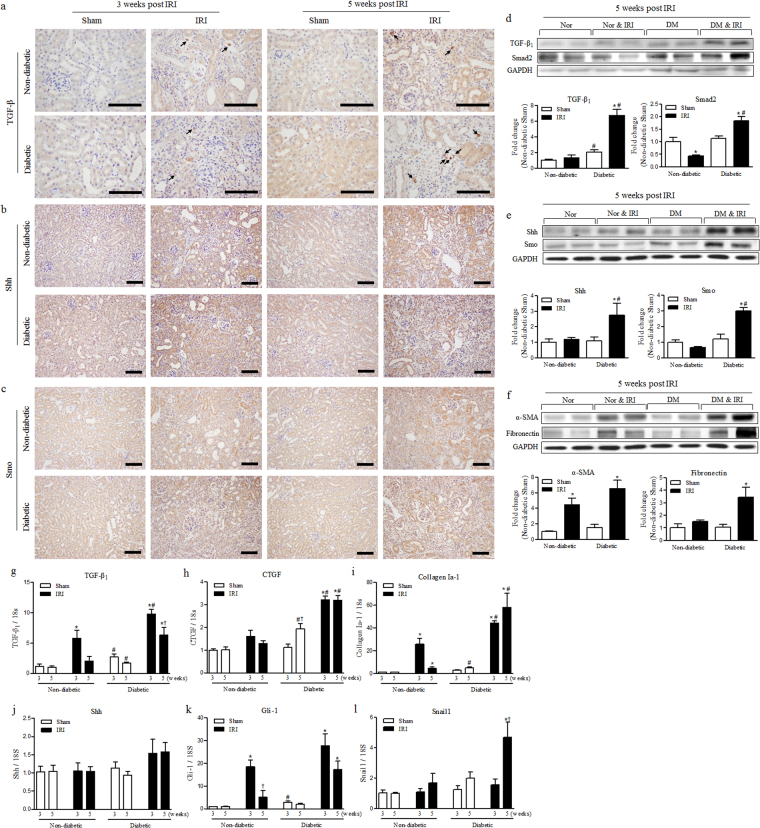
Figure 3.
Diabetes induced persistent activation of TGF-β1 and Shh signalling. (a–c) Immunohistochemistry for kidney levels of (a) TGF-β1, (b) Shh and (c) Smo at 3 and 5 weeks after IRI. Scale bar = 80 µm. (d) The kidney levels of expressed TGF-β1 and Smad2 were measured by western blot at 5 weeks after IRI. (e) The kidney levels of expressed Shh and Smo were measured by western blot at 5 weeks after IRI. (f) The kidney levels of expressed α-SMA and fibronectin were measured by western blot at 5 weeks after IRI. Each protein expression was normalized by GAPDH. The fold-change of each protein was calculated as the ratio of averages versus non-diabetic sham. (g–l) mRNA expression of the major TGF-β1 and Shh signalling pathway factors in the kidney were determined via qRT-PCR at 3 and 5 weeks after IRI. The targets of mRNA were (g) TGF-β1, (h) CTGF, (i) collagen I-a1, (j) Shh, (k) Gli-1 and (l) Snail1. Each value of the target mRNA was normalized by 18 S. Values are expressed as the mean ± S.E.M. * p < 0.05 versus sham, # p < 0.05 versus non-diabetic † p < 0.05 versus at 3 weeks.

