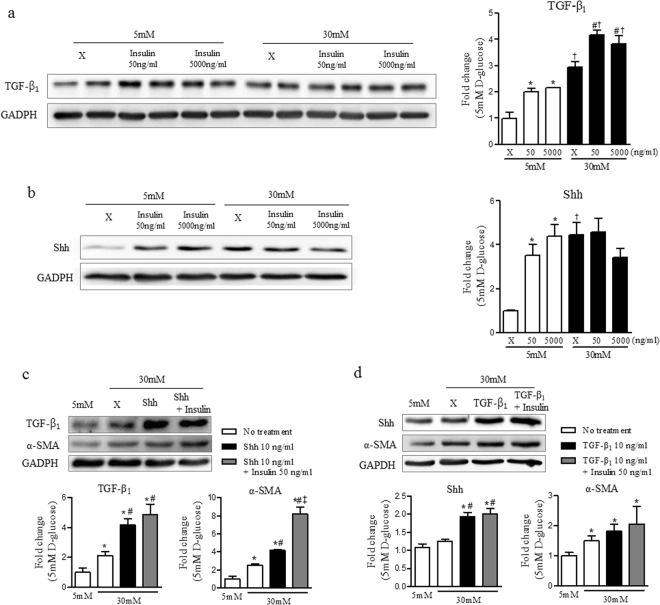
Figure 7.
Insulin increased the expressions of Shh and TGF-β1 without affecting the interaction between Shh and TGF-β1 in hyperglycaemic condition. (a) Expression level of TGF-β1 at 24 hours after insulin treatment. (b) Expression level of Shh at 24 hours after insulin treatment. (c) Expression levels of TGF-β1 and α-SMA at 24 hours after insulin and Shh treatment. (d) Expression levels of Shh and α-SMA at 24 hours after insulin and TGF-β1 treatment. Expression of each protein was normalized by GAPDH. The fold-change of each protein was calculated as the ratio of averages versus a 5 mM D-glucose control. Values are expressed as the mean ± S.E.M. * p < 0.05 versus 5 mM D-glucose, # p < 0.05 versus 30 mM D-glucose. † p < 0.05 versus between 5 mM D-glucose with insulin treatment and 30 mM D-glucose with insulin treatment. ‡ p < 0.05 versus 30 mM D-glucose with Shh or TGF-β1 treatment.

