Figure 5.
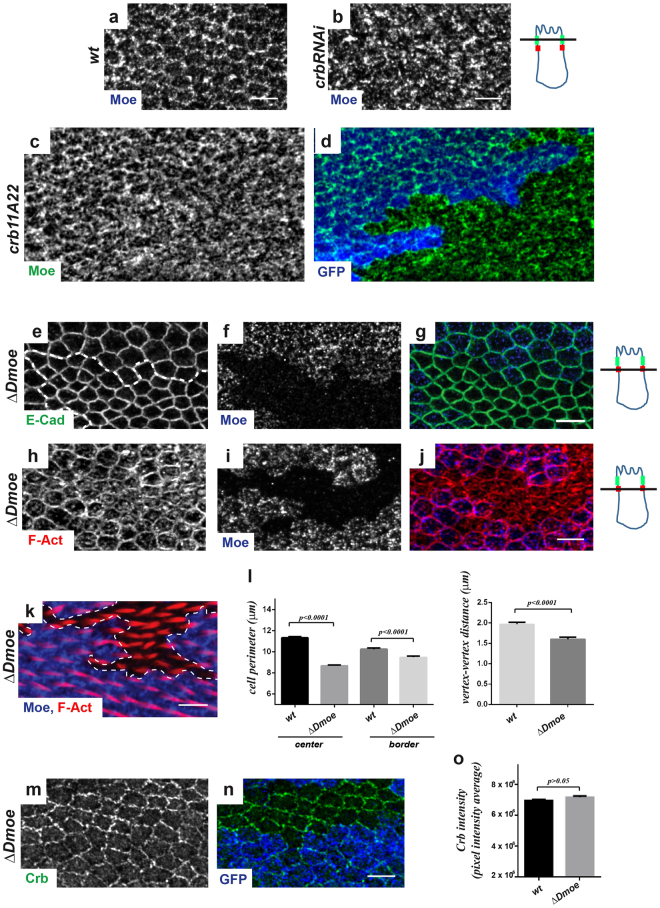
Loss of Moesin induces apical cell perimeter constriction, but does not affect adherens junctions. (a–d) Staining of Moe in wt (a), crbRNAi (b) or in crb 11A22 (c,d) pupal wing cells at 28–30 h APF. In crb 11a22 the wt twin clone is labelled by GFP expression (blue), Moe staining is in green (c,d). (e–k) Pupal wings containing Δmoe clones at 28–30 h (e–j) or 32–34 h (k) APF stained for E-cad (green), F-actin (red) or Moe (blue). E-cad and F-actin staining revealed defects in cell perimeter (e,h) or apical F-actin redistribution (h). On the right of panels a-j, drawn orthogonal views of a wing epithelial cell where the focal plane positions of the confocal image projections in the left panels are indicated (black line). All images are maximal projections of 2 up to 6 optical sections (every 0.2 μm). Distal is right, proximal left. Scale bar: 10 μm. (l) Quantification of cell perimeter length (Left) and vertex-vertex distances (Right) (μm) in wt and Δmoe clones (in the center of the clone and along the border of the clone) in wings at 28–30 h APF. Bars indicate mean values ± SEM and statistical significance was analyzed by Student’s t-test [Δmoe clones versus wt cells, ncells = 200, P < 0.0001, see the main text]. (m,n) Pupal wings containing Δmoe clones at 28–30 h APF stained for Crb (green). Moe depletion is revealed by the absence of GFP (blue). Distal is right, proximal left. Scale bar: 10 μm. (o) Quantification of Crb staining at the SAR in wt and Δmoe clones (in the center of the clone and along the border of the clone) in pupal wings at 28–30 h APF. Crb intensity per length unit (pixel intensity average) at the apico-lateral cortex was calculated and expressed in A.U. Bars indicate mean values of intensity ± SEM and statistical significance was analyzed by Student’s t-test [Δmoe = 7.18 ± 0.08 × 10⁶ A.U., versus wt = 6.96 ± 0.08 × 10⁶ A.U., nwings = 5, ncells = 70; P > 0.05].

