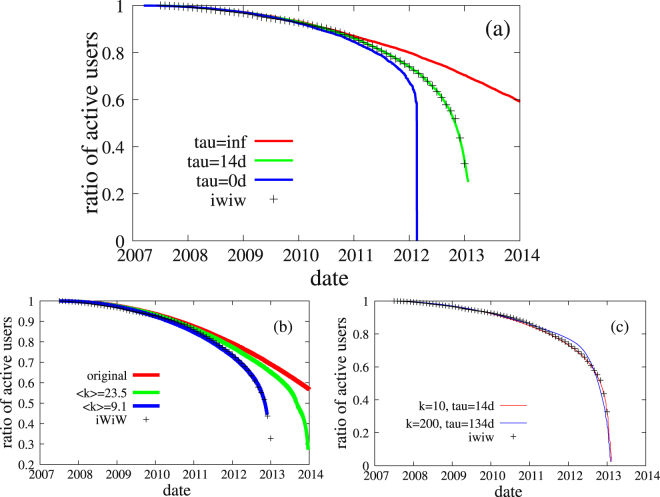
Figure 7.
Time evolution of the active users in iWiW. (a) The cumulative fraction of active users (all users having a last login date after the indicated time) in iWiW (crosses) and in the cascade model (green). For comparison we show also results with zero characteristic leaving time (blue), and with zero threshold, i.e. no social effect (red). Parameters: N = 10000, 〈k〉 = 10. (b) The cumulative fraction of active users in iWiW and in the model using a county as the underlying network of the model. (c) Model fits using random network with average degree 〈k〉 = 10, 200.

