Figure 2.
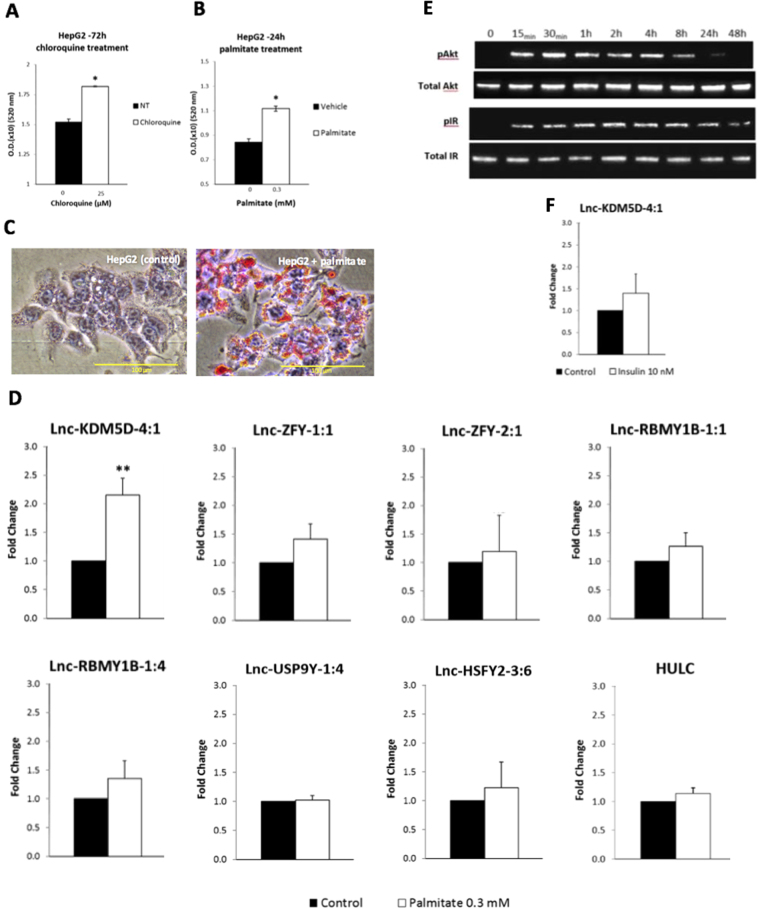
Expression of MSY lincRNAs in palmitate-induced steatosis and in insulin-resistant HepG2 cells. (A,B) Quantification of the lipid accumulation by absorbance measurement after treatment with palmitate at 0.3 mmol/L (0.3 mM) (A), and chloroquine (as positive control) at 25 µmol/L (25 µM) (B). Microscopy results of the intracellular distribution of lipid droplets stained in red by the Oil Red O solution after 24 h of treatment with either the vehicle or with the palmitate (C). The addition of palmitate after 24 h triggers a significant increase (Fold Change = 2.16; p-value = 0.00216) in the expression of lnc-KDM5D-4:1 in HepG2 cells in comparison to cells not treated with palmitate (control cells) (D). No significant increase in the expression of lnc-ZFY-1:1, lnc-ZFY-2.1, lnc-RBMY1B-1:1, lnc-RBMY1B-1:4, lnc-USP9Y-1:4, lnc-HSFY2-3:6, and HULC is observed. (E) Western blot analysis of phosphorylated protein kinase B (pAkt), Total Akt, phosphorylated insulin-receptor (pIR), and Total IR (gel cropped). Antibodies were used to immunodetect the levels of pAkt, Total Akt, pIR and Total IR in an increasingly insulin-resistance HepG2 cell line. For protein phosphorylation detection, 10 nM insulin was added for 30 min before cell lysates harvest at the indicated time. Western blot analysis was performed on two independent experiments (Uncropped gel images Supplementary Figure S1). (F) Real-time PCR results of the 24 h insulin-stimulated HepG2 cells with no significant changes in the expression of lnc-KDM5D-4:1 in comparison to the cells not treated (control cells) (Fold Change = 1.39; p-value > 0.05). Data are relative to the housekeeping gene actin beta (ACTB). Error bars indicate ± SD calculated from sextuplicate wells (A,B). NT, no treatment; (n = 4). Statistical significance: *p-value < 0.05; **p-value < 0.01.

