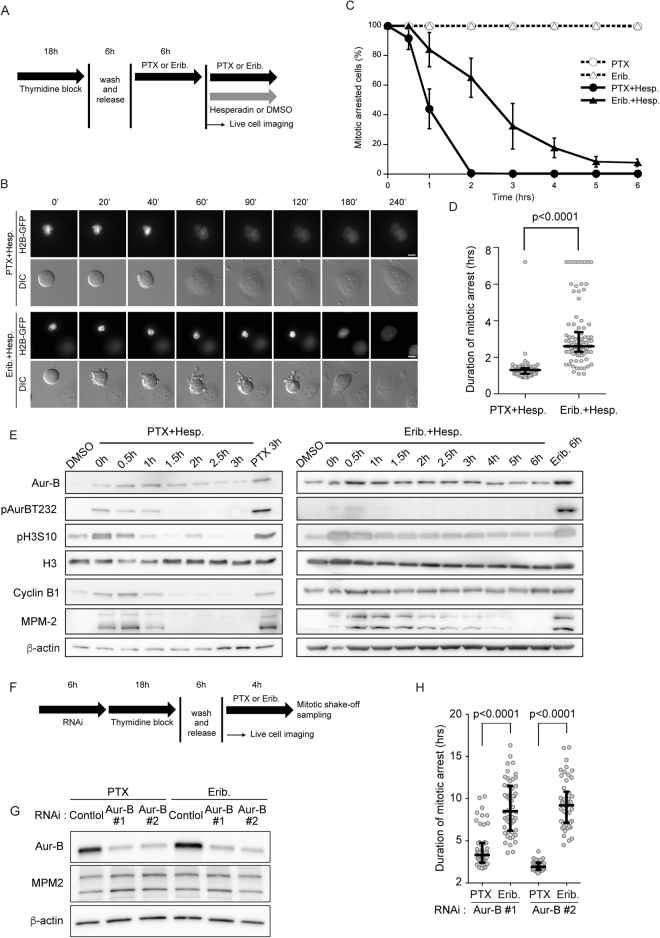
Figure 2.
Effect of inhibition of Aurora B during paclitaxel- or eribulin-induced mitotic arrest. (A) Schemes of experiments shown in Fig. 2B–D. (B) Select frames from live-cell imaging of representative HeLa/H2B-GFP cells. Synchronized HeLa/H2B-GFP cells were cultured with 100 nM paclitaxel (PTX) or 10 nM eribulin (Erib) for 6 h after release. Then, DMSO or 50 µM hesperadin (Hesp) was added. Time (min) after the addition of hesperadin or DMSO is shown on the images. Scale bar, 5 µm. (C) Percentage of cells arrested in mitosis in the presence of the different drugs. Live-cell images were analyzed at 6 h from the addition of Hesp or DMSO. Data are mean values from three independent experiments; error bars, ± SD, number of cells, 100 per experiment. (D) Live-cell images were analyzed from the time of addition of Hesp to the onset of mitotic exit in PTX + Hesp and Erib + Hesp cells. Open circles represent individual cells. The duration of mitotic arrest was measured from the time of addition of hesperadin to the onset of mitotic exit in every 100 cells per experiment. Horizontal bar, median; vertical bar, interquartile range. (E) Synchronized HeLa cells were cultured with 100 nM PTX or 10 nM Erib for 6 h. HeLa cells that underwent mitosis arrest were harvested by mitotic shake-off and transferred into fresh medium containing the test drugs. Immunoblot analysis was performed using antibodies against the indicated proteins. The levels of MPM-2 and cyclin B1 were determined as the mitosis-specific markers. (F) Schemes of experiments shown in Fig. 2G-H. (G) HeLa cells were transfected with Aurora B siRNAs as indicated; after then, cells were synchronized by a single thymidine block and then after 6 h released into PTX or Erib for 4 h. Mitotic cells were harvested by mitotic shake-off. Immunoblot analysis was performed using antibodies against the indicated proteins. The levels of MPM-2 were determined as a mitosis-specific marker. (H) Aurora B depleted- and synchronized-HeLa cells were prepared as shown in F-G. Live-cell images were analyzed from the time of NEBD to chromosome decondensation in PTX- or Erib-treated cells (n ≥ 50) from three independent experiments. Open circles represent individual cells. Horizontal bar, median; vertical bar, interquartile range.

