Figure 4.
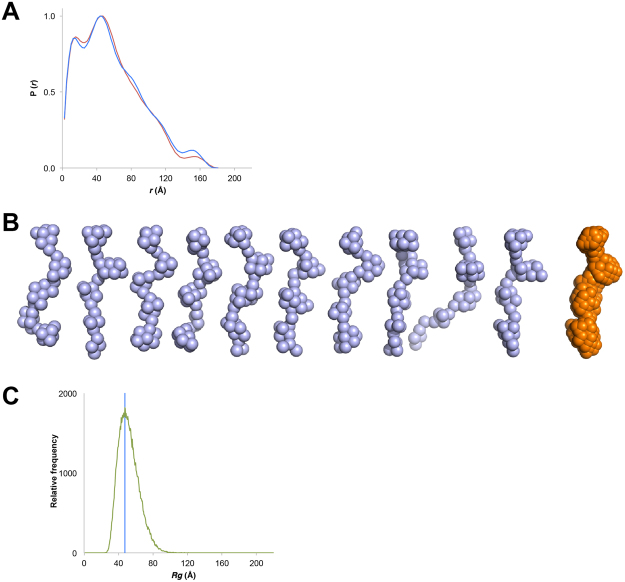
Structure of the cortactin repeats. (A) Normalized pair distribution function P(r) for cortactinCRH calculated with GNOM44. 1.1 mg/mL (blue) and 0.4 mg/mL (red) samples. (B) Ab initio models of CortactinCRH show extensive conformational diversity (blue). The averaged model (orange) is elongated. Models were calculated by use of DAMMIF45. (C) Calculated R g values for the cortactinCRH sequence. Relative frequency of calculated R g values from analysis of 100,000 molecular models of cortactinCRH as an unfolded protein based on its sequence by use of the program Flexible-Meccano31. Frequency of calculated R g values (green) is compared to the observed R g for cortactinCRH. The experimental R g of cortactinCRH falls at the distribution peak of the calculated range.

