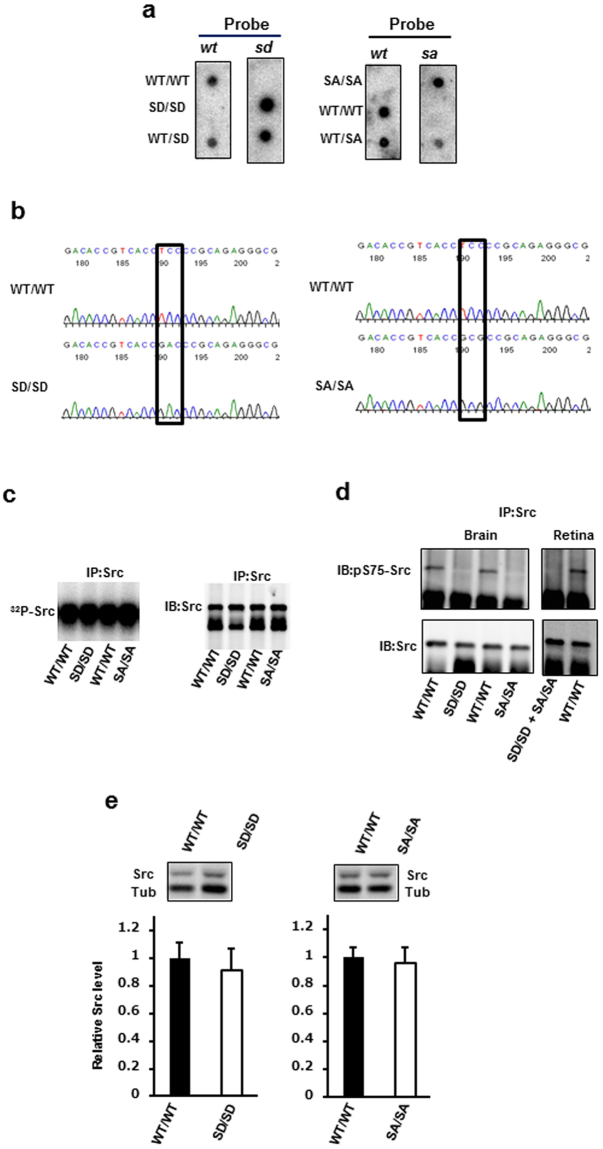
Figure 1.
Generation of Src S75D (SD) and Src S75A (SA) mutant mice and verification of mutations. (a) Genotype analysis of littermates derived from SD or SA heterozygotes. Tail DNA was amplified by PCR and subjected to dot-blot analysis with ASO probes. ASO probes wt, sd and sa were identical to the normal, SD mutant and SA mutant sequences, respectively. (b) Chromatogram showing the presence of the TCC → GAC and TCC → GCG mutations at codon Ser75 in SD/SD and SA/SA mutant mice, respectively. Src cDNA was reverse-transcribed from RNA isolated from retinas from mice of the indicated genotype, amplified by PCR and then subjected to sequencing. (c) Autophosphorylation kinase assay from neural tissue extracts. Brain lysates from WT/WT, SD/SD and SA/SA mice aged 6 months were immunoprecipitated with monoclonal anti-Src antibody 327 and then subjected to immunoblot analysis (right) and autophosphorylation assay (left). Protein images were acquired using a LAS 1000 Image Analyzer. Autophosphorylation was detected using a BAS 2500 Image Analyzer. IP, immunoprecipitation; IB, immunoblot. (d) Lack of Ser75 phosphorylation in Src from the mutants. Brain (left) or retina (right) lysates from WT/WT and mutant mice aged 17–22 months were immunoprecipitated with anti-Src antibody 327 and subjected to immunoblot analysis with an anti-Src phospho-Ser75 antibody. Blots were stripped and reprobed with anti-Src antibody 327. Equal amounts of retinal lysates from SD/SD and SA/SA were mixed and analysed as described above. (e) Quantitation of Src protein levels in the retina. Cell lysates were prepared from the retinas of SD/SD, SA/SA and their WT counterparts aged 6–8 months and then subjected to anti-Src immunoblot analysis. Src protein levels were normalised to those of 55 kDa β-tubulin (Tub). n = 8 for WT/WT and SD/SD; n = 7 for SA/SA. Data are means ± s.d. Unpaired two-tailed t-test. The full-size dot blots for Fig. 1a, the full-length autoradiograph for Fig. 1c, and the full-length blots for Fig. 1d,e are presented in Supplementary Figs S2–S5.

