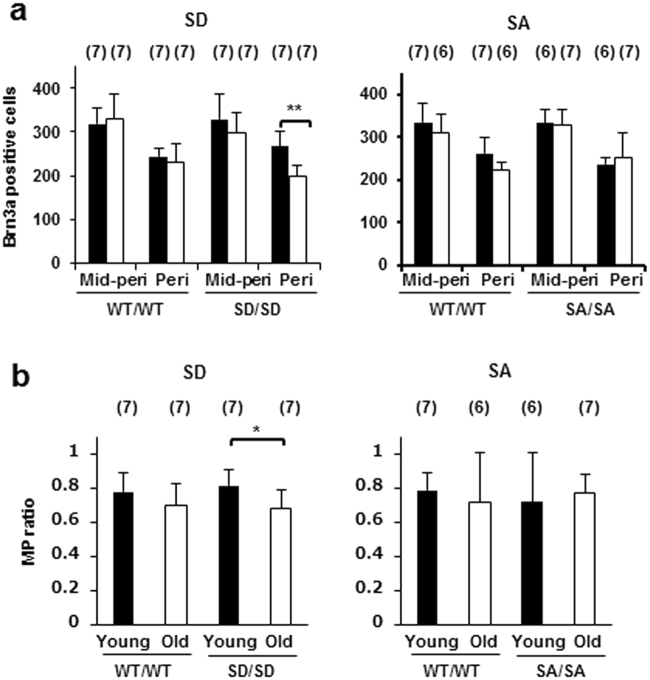
Figure 4.
RGC numbers in mid-peripheral and peripheral regions of retinas derived from SD/SD and SA/SA mutant mice. (a) Brn3a-positive RGCs were counted in mid-peripheral and peripheral regions of retinas obtained from young (■) and ageing (□) SD/SD (left) and SA/SA (right) mutant mice. Paired factorial ANOVA and Bonferroni post hoc test, **P < 0.01. (b) Ratios of RGC number in the retina at the periphery to that at the mid-periphery. The ratios (MP ratio) were calculated for WT and homozygous young and ageing SD/SD (left) and SA/SA (right) mutant mice. Factorial ANOVA and Bonferroni post hoc test, *P < 0.05. (a,b) Mid-peri, mid-peripheral region; Peri, peripheral region; Young, young mice; Old, ageing mice. Sample numbers are shown in parentheses. Data are means ± s.d.

