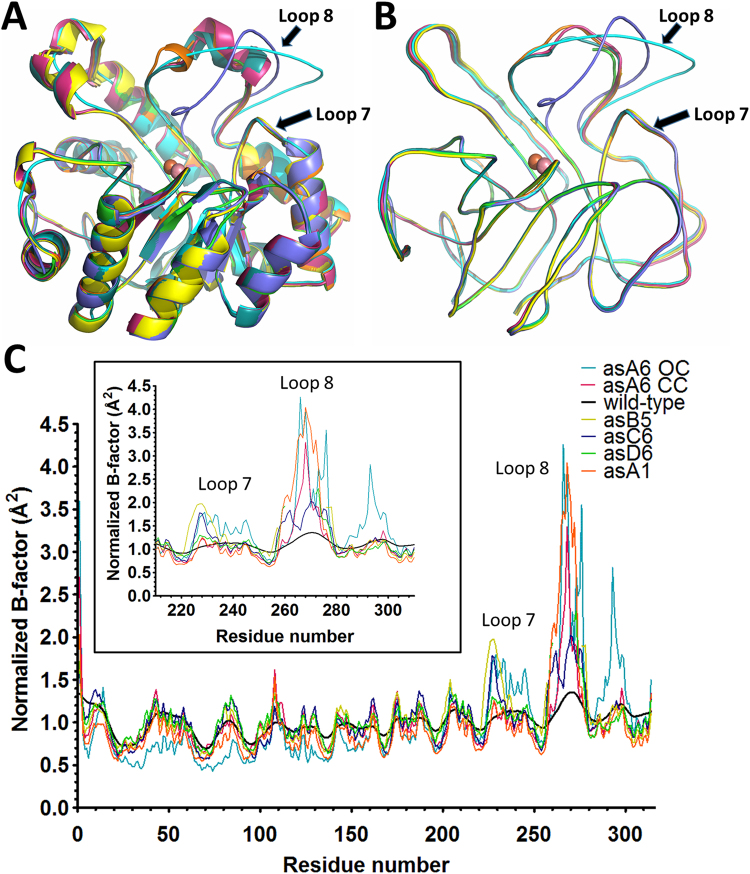
Figure 5.
Mutants’ active site loop 8 exhibit higher conformational flexibility. (A) Cartoon representation of the superposition of the structures (monomers) of wt-Ssopox (dark green), αsA1 (orange), αsB5 (yellow), αsD6 (green), αsC6 (blue), αsA6-CC (magenta) and αsA6-OC (cyan). (B) Smoothed ribbon representation of the superposition of the structures (monomers) of of wt-Ssopox (green), αsA1 (orange), αsB5 (yellow), αsD6 (green), αsC6 (blue), αsA6-CC (magenta) and αsA6-OC (cyan). (C) Positional distributions of normalized B-factor values (the x-axis represents residue number) for wt-SsoPox (black line), αsA1 (orange), αsB5 (yellow), αsD6 (green), αsC6 (blue), αsA6-OC (blue line) and (magenta line). A zoomed inset highlights the loop 7 and 8 sequence region.

