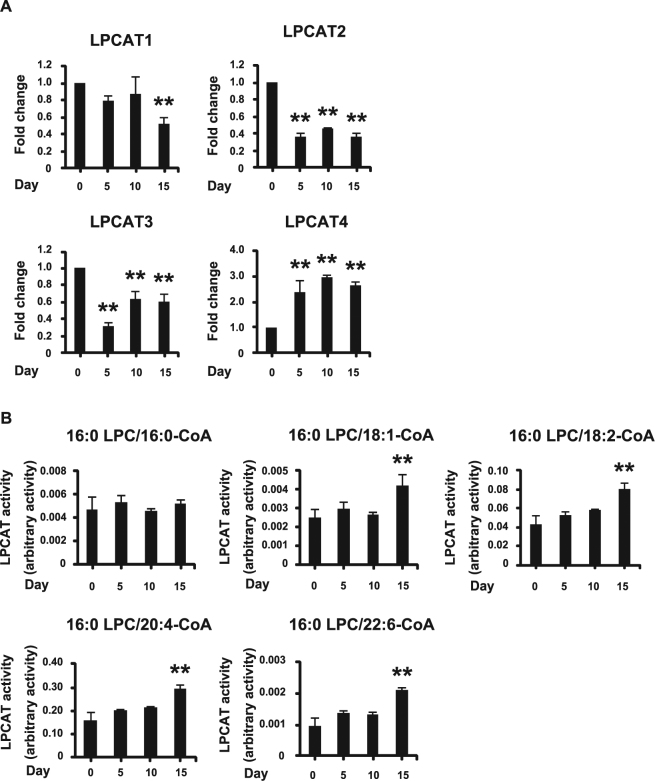
Figure 2.
LPCAT4 mRNA expression and LPCAT enzymatic activity increase during chondrogenic differentiation of ATDC5 cells. (A) mRNA levels of LPCATs in ATDC5 cells cultured in α-MEM with 50 ng/ml ascorbic acid and 1% ITS. The fold increase in mRNA expression was calculated relative to day 0 (day 0 = 1) and normalized to GAPDH. Error bars represent mean ± S.D., n = 3. **p < 0.01, compared with day 0, post-hoc test (Bonferroni’s correction) after one-way ANOVA. (B) LPCAT enzymatic activity in ATDC5 cells measured with 16:0-, 18:1-, 18:2-, 20:4-, and 22:6-CoA as donors. Error bars represent mean ± S.D., n = 3. **p < 0.01, compared with day 0, post-hoc test (Bonferroni’s correction) after two way ANOVA.

