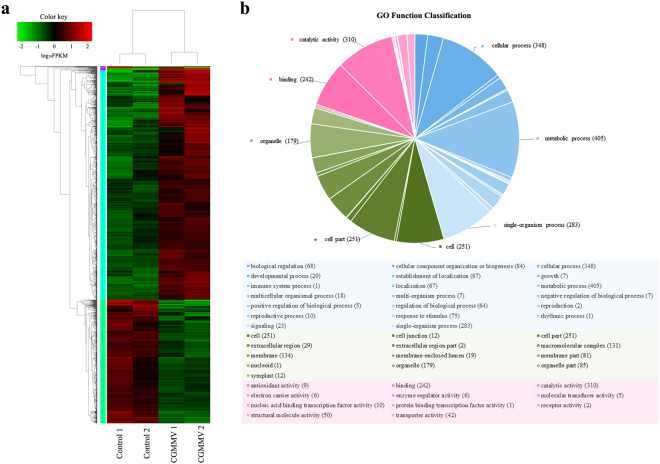
Figure 2.
Transcriptome analysis of DEGs in CGMMV-inoculated and mock-inoculated watermelon fruits. (a) Hierarchical clustering of DEGs based on log10 FPKM values. The color (from green to red) represents gene expression intensity (log10 FPKM) from low to high. (b) GO function classification of DEGs. The pie chart shows the percentage of DEG numbers of each GO functional group (GO term). Each piece of the pie represents a GO term and all DEGs that belonged to the three main categories (‘biological processes’, ‘cellular components’, and ‘molecular functions’) are filled with blue, green, and pink, respectively. The annotation functions of the top 2/3 numbers of DEGs in each main category are marked in the pie chart.

