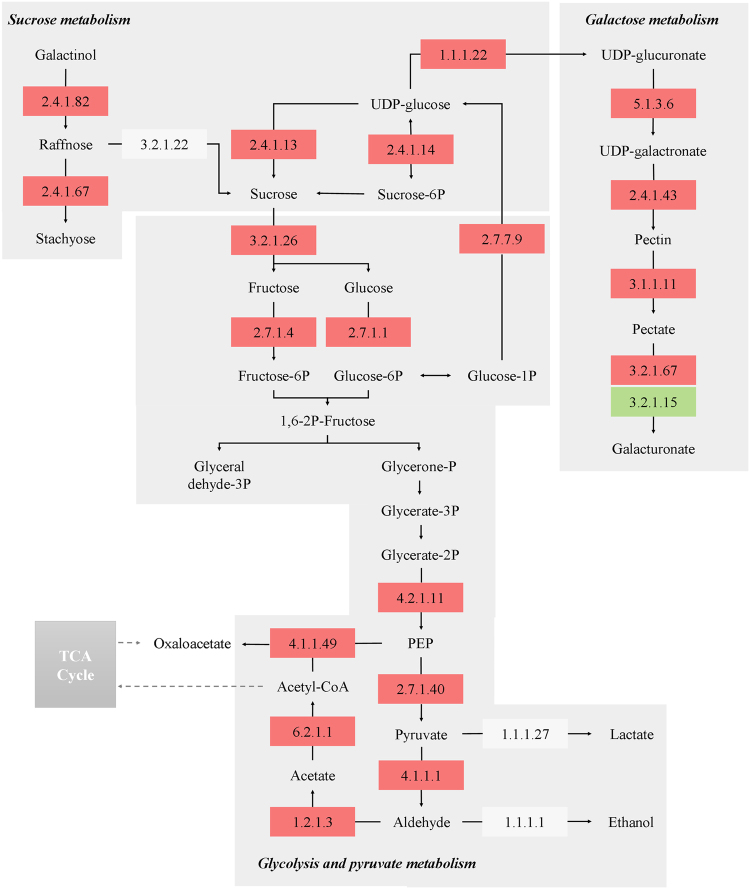
Figure 4.
Network diagram of key carbohydrate metabolism-related DEGs of watermelons in response to CGMMV infection. The EC numbers of key enzymes participating in the carbohydrate metabolism are shown in the boxes. The different colors of the boxes indicate that the enzyme encoding genes were up-regulated (red), down-regulated (green), or slightly changed (white), respectively. The list of key enzymes in the diagram was as following: 2.4.1.82, raffinose synthase; 2.4.1.67, stachyose synthase; 3.2.1.22, alpha-galactosidase (GLA); 2.4.1.13, sucrose synthase (SS); 2.4.1.14, sucrose-phosphate synthase (SPS); 1.1.1.22, UDP-glucose 6-dehydrogenase (UGDH); 3.2.1.26, beta-fructofuranosidase (cell wall invertase); 2.7.1.4, fructokinase; 2.7.1.1, hexokinase (HK); 2.7.7.9, UTP-glucose-1-phosphate uridylyltransferase; 4.2.1.11, enolase (ENO); 2.7.1.40, pyruvate kinase (PK); 4.1.1.1, pyruvate decarboxylase (PDC); 1.1.1.27, L-lactate dehydrogenase (LDH); 1.1.1.1.1, alcohol dehydrogenase (ADH); 4.1.1.49, phosphoenolpyruvate carboxykinase (PEPCK); 6.2.1.1, acetate-CoA ligase (ACS); 1.2.1.3, aldehyde dehydrogenase (ALDH); 5.1.3.6, UDP-glucuronate 4-epimerase; 2.4.1.43, alpha-1,4-galacturonosyltransferase (GAUT); 3.1.1.11, pectinesterase; 3.2.1.67, galacturan 1,4-alpha-galacturonidase; 3.2.1.15, polygalacturonase.

