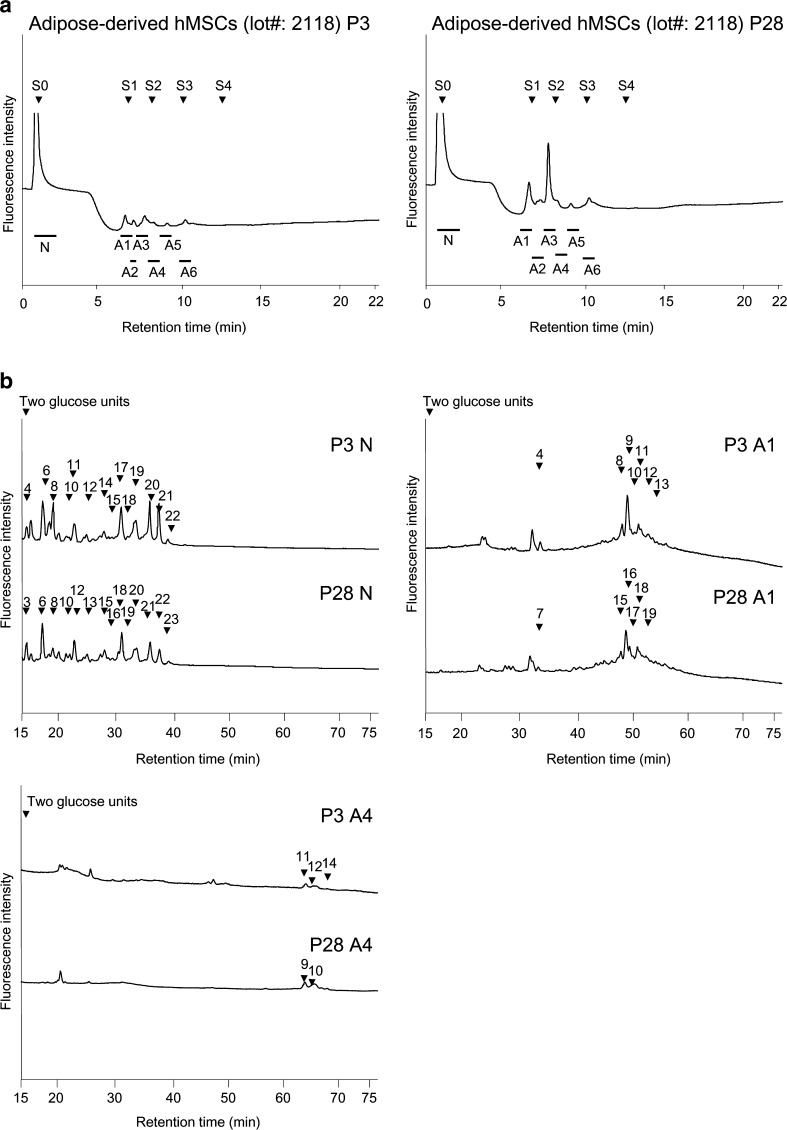
Fig. 1.
Comparison of HPLC profiles of glycans derived from adipose-derived hMSCs lot#: 2118 P3 and P28. a Anion-exchange HPLC profiles. S0, S1, S2, and S3 are standard N-glycans containing 0, 1, 2, and 3 Sia residues. b Size-fractionation HPLC profiles of neutral fraction (N), monosialylated N-glycan fraction (A1), and disialylated N-glycan fraction (A4). Following anion-exchange HPLC, further purification was performed. Each peak was pooled, and when necessary, was further purified by reversed-phase HPLC, or subjected to further structural analysis. Arrowheads indicate the peak numbers

