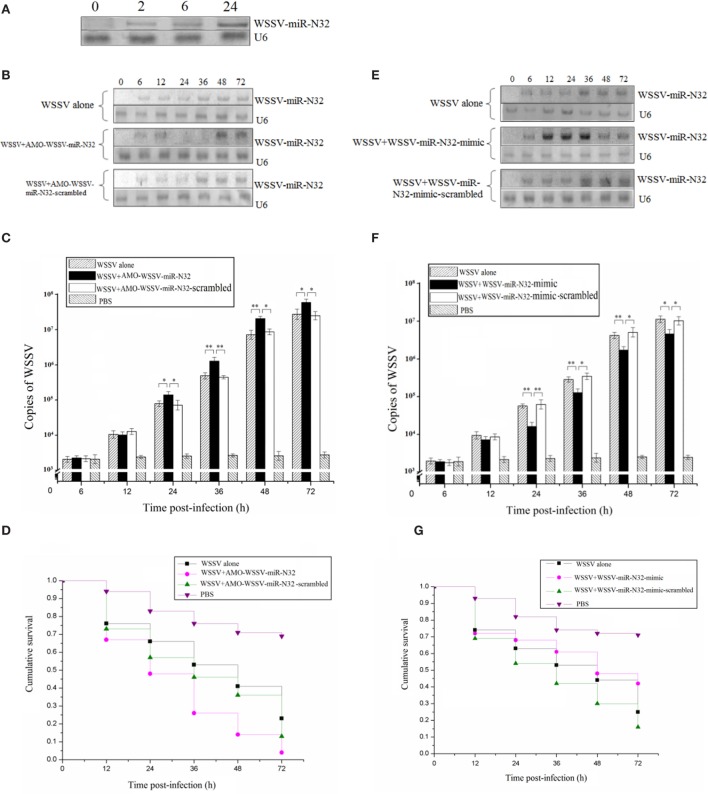
Figure 1.
Role of white spot syndrome virus (WSSV)-miR-N32 in the virus infection. (A) The time-course detection of WSSV-miR-N32 in the WSSV-challenged shrimp. The shrimp were infected with WSSV. At different time postinfection, the expression of WSSV-miR-N32 in shrimp hemocytes was detected with Northern blots. The probes used were indicated at the right. U6 was used as a control. (B) The silencing of WSSV-miR-N32 in shrimp. Both WSSV and anti-miRNA oligonucleotide (AMO)-WSSV-miR-N32 or AMO-WSSV-miR-N32-scrambled were co-injected into shrimp. At different time points postinfection, the shrimp hemocytes were collected and subjected to Northern blot analysis. The probes were indicated at the right. U6 was used as a control. (C) The influence of WSSV-miR-N32 silencing on the WSSV copies in shrimp. Quantitative real-time polymerase chain reaction (PCR) was conducted to quantify the virus copies in shrimp treated with WSSV and AMO-WSSV-miR-N32 or AMO-WSSV-miR-N32-scrambled. For each treatment, three shrimp were randomly selected and the mixed RNAs of three shrimp were analyzed by quantitative real-time PCR. (D) The evaluation of shrimp cumulative survival. The treatments were shown on the top. The shrimp mortality was examined at different time after treatment. (E) The overexpression of WSSV-miR-N32 in shrimp. Shrimp were co-injected with WSSV and WSSV-miR-N32-mimic or WSSV-miR-N32-mimic-scrambled, followed by Northern blots to detect the WSSV-miR-N32 expression. (F) The quantification of WSSV copies in shrimp. The virus copies in shrimp were evaluated using quantitative real-time PCR. Three shrimp, selected at random for each treatment, were used for this analysis. The treatments were indicated on the top. (G) The shrimp survival analysis. After the overexpression of WSSV-miR-N32, the shrimp mortality was examined. In all panels, the significant differences between treatments were indicated with asterisks (*p < 0.05; **p < 0.01). The significance of difference between treatments was evaluated with Student’s t-test using the data of three independent assays for each treatment.

