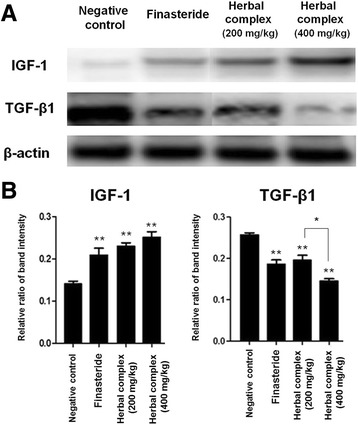
Fig. 4.

IGF-1 and TGF-β1 Western blot analysis. a A western blot assay was performed to compare each group. In the experimental group (both the 200 and 400 mg/kg groups), IGF-1 expression was much higher and TGF-β1 expression was much lower compared with the negative control group (p < 0.05). Higher doses (400 mg/kg) in the herbal complex treated animals resulted in decreased expression of TGF-β1 (p < 0.05) than seen in the low-dose (200 mg/kg) groups. b Quantitative representation of IGF-1 and TGF-β1 expression. Data are presented as the mean ± SD. **p < 0.001 compared with negative control, *p < 0.05 herbal complex 200 mg/kg vs. 400 mg/kg group. Herbal complex = Houttuynia cordata Thunb, Perilla frutescens Britton var. acuta, and Green tea
