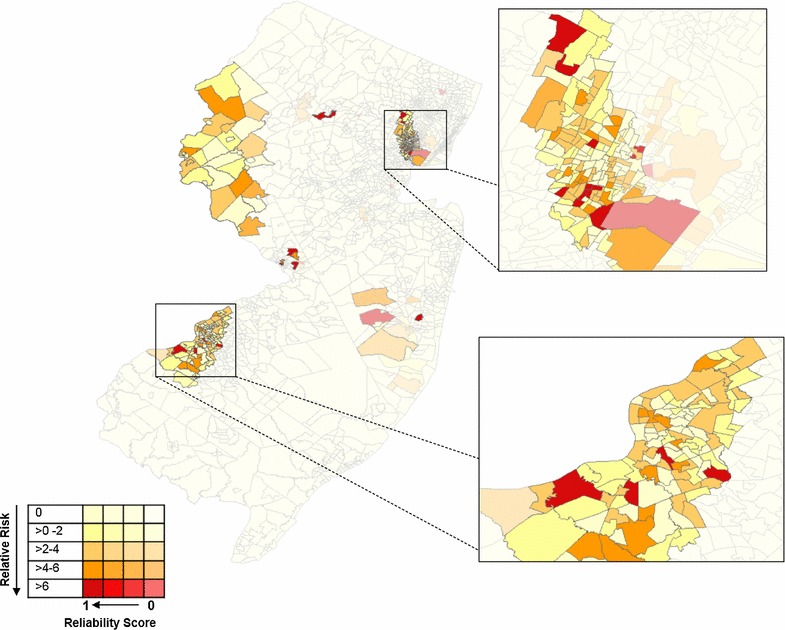
Fig. 3.

Reliable, high-risk legionellosis clusters detected utilizing reliability score methodology and SaTScan™ software with census tract as geographic unit, in New Jersey, USA, 2003–2013. The variable was stratified into 0.1 increments and each increment was assigned its own data layer. Census tracts with a reliability score of 0 were presented at 80% transparency and with each reliability score category a 20% transparency deduction was made until the census tracts with the highest relatability scores would be fully opaque. Within each transparency layer, relative risk was categorized into five groups, each assigned a distinct color. The highest relative risk category was assigned a bold, dark red. With each decreasing relative risk category, the color scheme became more muted such that the lowest category was assigned a very pale yellow/nude color
