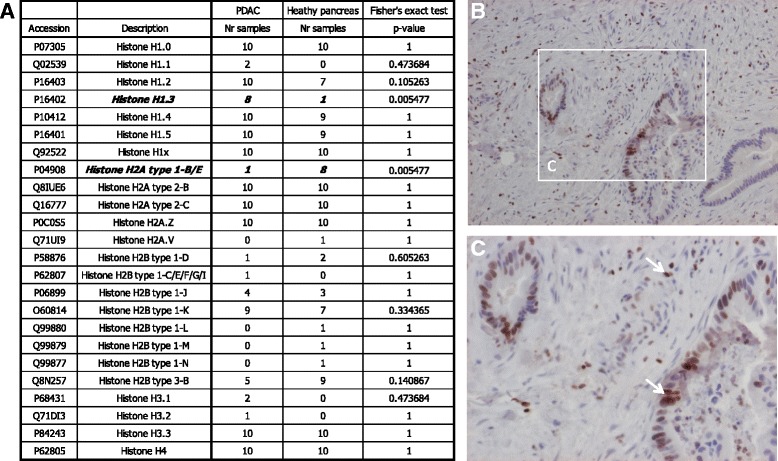
Fig. 1.

Profile of histone variants and H1.3 distribution in PDAC tissue. Histone variant profile is summarized in (A). Positive staining of H1.3 in PDAC is illustrated in (B) and (C). Positive H1.3 staining of tumor cells and TILs is indicated by the arrows. The images were magnified 10× (B) and 20× (C)
