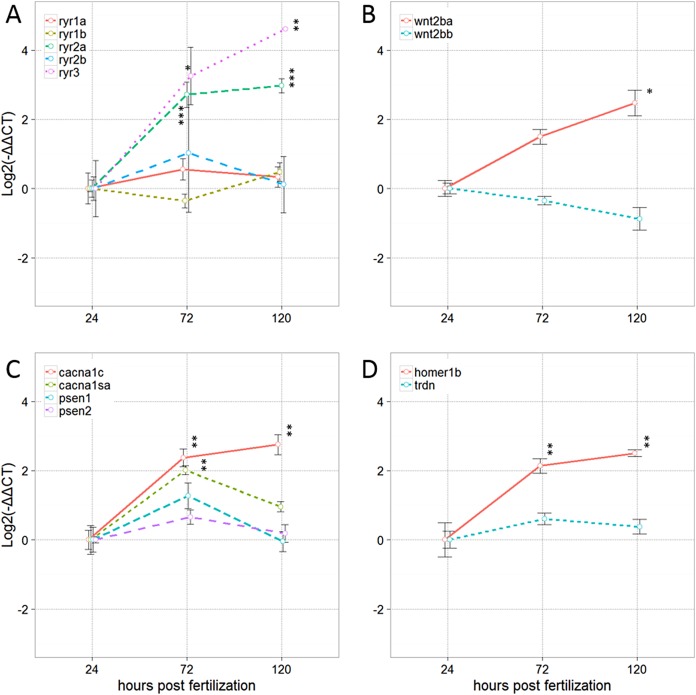
Figure 2. Relative expression of transcripts encoding ryanodine receptor (RyR) paralogs and regulatory molecules at 24, 72 and 120 hpf.
(A) Zebrafish RyR paralogs; (B) Wnt2 orthologs; (C, D) RyR regulatory molecules. Data are shown as the mean ± SE (n = 3 independent biological replicates). Within each sample, values for the target transcript were normalized to the average of the values for the reference genes, actb2 and eef1a1, within that same sample. *Significantly different from 24 hpf at P < 0.05, **P < 0.01, ***P < 0.001, as determined by one-way ANOVA followed by Tukey’s post hoc test, or if data did not meet the ANOVA assumptions, as determined by the Kruskal–Wallace test followed by the Nemenyi–Damico–Wolfe–Dunn post hoc test.

