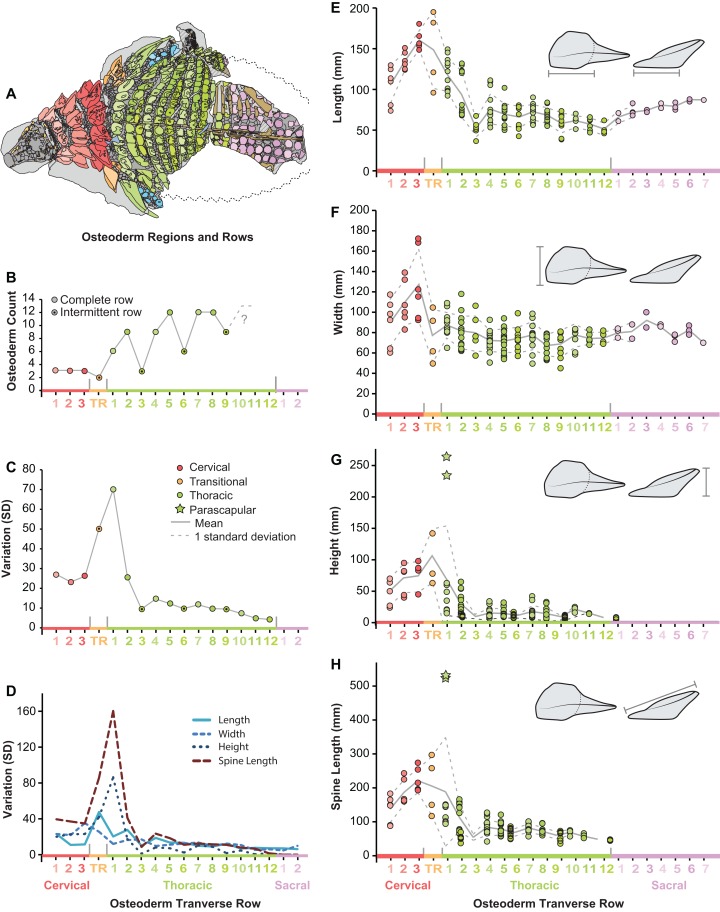
Figure 8. Plots illustrating osteoderm count, variation, and linear measurements across the transverse osteoderm rows.
(A) Line drawing illustrating color coding of osteoderm regions and transverse rows in TMP 2011.033.0001 (see Fig. 6). (B) Osteoderm count for each transverse row. (C) Total variation within each osteoderm row. (D) Variation of each linear metric within each osteoderm row. Raw measures of osteoderm anteroposterior length (AP-L) (E), transverse width (T-W) (F), osteoderm height (H) (G), and total spine length (SL) (H). Stars in (G) and (H) indicate outlying parascapular spine morphs.

