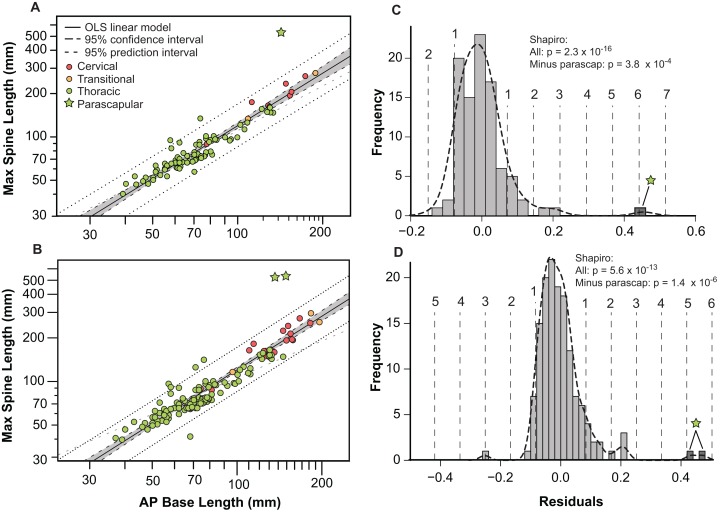
Figure 9. Allometry of osteoderms.
Spine length (SL) regressed as a function of anteroposterior basal length (AP-L) for bilaterally averaged (A) and bilaterally independent (B) osteoderms. Colors pertain to osteoderm region (see Fig. 6). Ordinary least squares regression indicated by solid line (Table 1), shaded area indicates 95% CI of the relationship, and dotted lines indicate 95% predication interval of points. Plots (C) and (D) illustrate histograms of the residuals of (A) and (B) (respectively) with vertical dotted lines indicating standard deviations. Stars indicate outlying parascapular spines.

