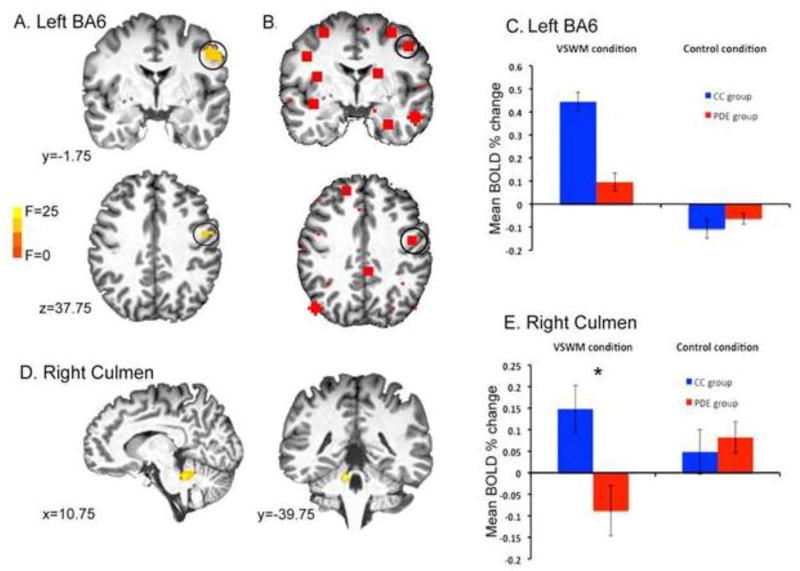
Figure 3.
Group by task condition interactions: A. Left BA6. B. Corresponding node in network analysis. C. BOLD percent change versus rest by group and condition. D. Right culmen (no corresponding node in the network analysis). E. BOLD percent change versus rest by group and condition (error bars=SEM)* p < 0.001 CC versus PDE.

