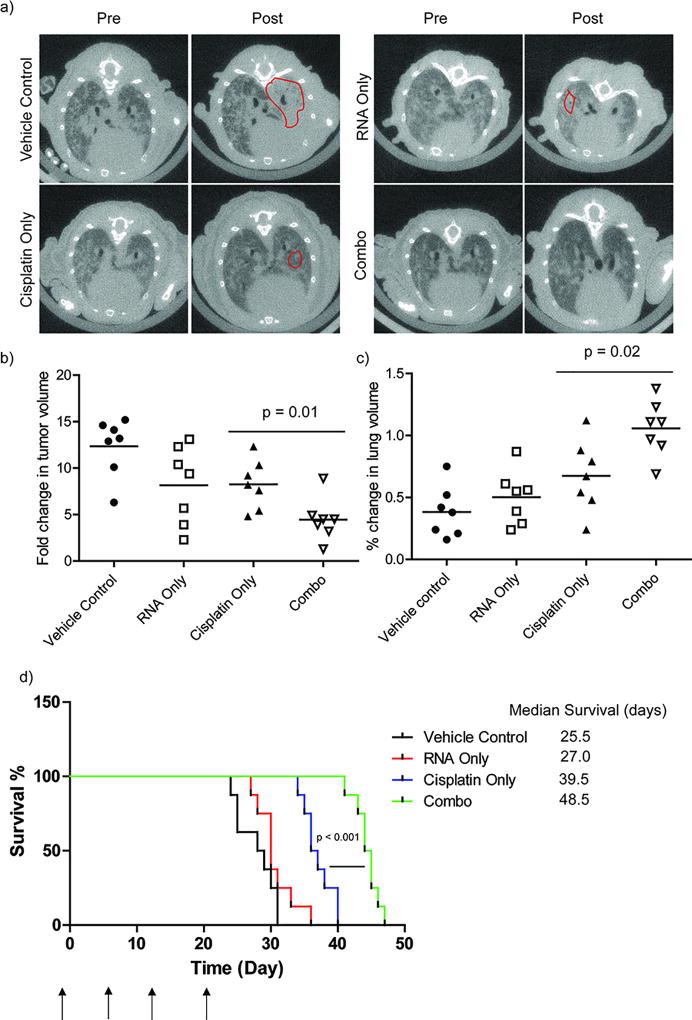
Figure 4.
Combination therapy in LbL nanoparticle promote the treatment efficacy in vivo. (a) Representative axial images of mouse lungs harboring KP tumors. The darker areas represents healthy lung whereas the lighter shades indicate areas populated by tumor cells. (b) Quantification of tumor volumes. (c) Quantification of healthy lung volumes using GE eXplore software. One or two independent lung tumors from each mouse were quantified. (d) A Kaplan-Meier curve comparing survival of mice treated with different groups. The median survival days were calculated from the Kaplan-Meier curve using GraphPad Prism software. N (number of mice in each group) = 7

