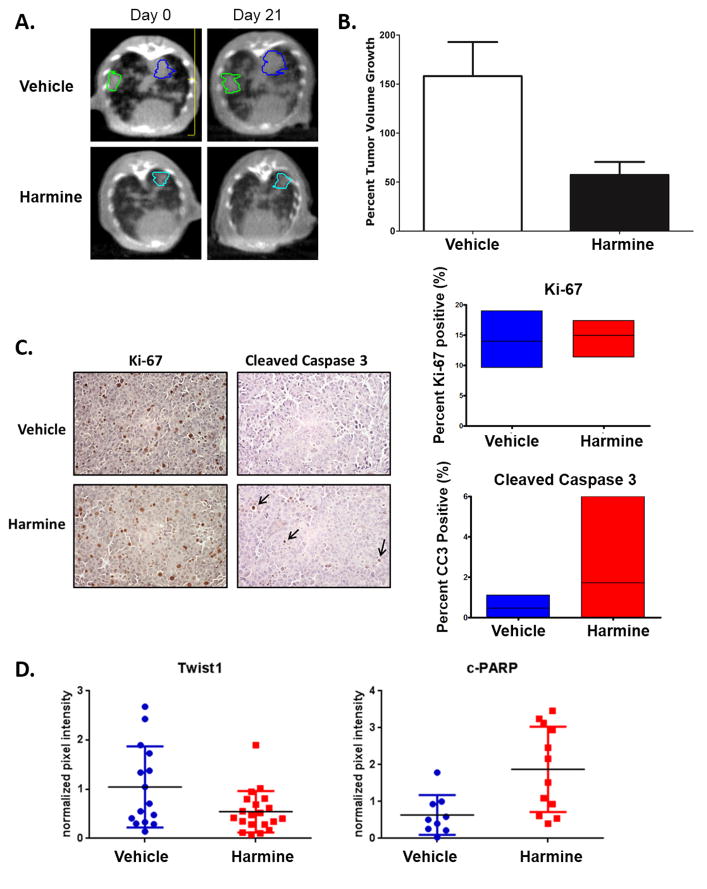
Figure 7. Harmine has activity in a KrasG12D/Twist1 mouse model of autochthonous lung adenocarcinoma.
(A) Representative microCT images of autochthonous lung tumors showing decreased lung tumor growth 3 weeks following treatment with harmine versus vehicle in the CCSP-rtTA/tetO-KrasG12D/Twist1-tetO7-luc (CRT) mice. Contoured lung tumors represent index lesions followed serially for tumor volume quantification. (B) Lung tumor volumes were quantified at baseline and weekly with serial micro-computed tomography (microCT) in the same CRT mice. Micro- CT images were reviewed by a board certified radiation oncologist on multiple index tumors in a blinded fashion (n=18 tumors for vehicle from 6 mice and n=16 from 5 mice for harmine). Difference was statistically different using a Mann-Whitney test, P=0.0025. Volumes were normalized to the starting volume, t= 0 before harmine treatment, and percent tumor volume growth was then calculated by (normalized tumor vol. × 100%) − 100%. (C) LEFT: Treatment with harmine results in similar proliferation levels as measured by Ki-67 staining, but increased apoptosis as measured by cleaved caspase 3 staining indicated by black arrows. RIGHT: Quantification and comparison of Ki-67 staining (n=12 tumors for vehicle and n=15 for harmine) (p= 0.3621) and cleaved caspase 3 IHC (n=12 tumors for vehicle and n=16 for harmine) (p= 0.0453). (D) Quantification of Twist1 and cleaved PARP protein levels in vehicle and harmine treated animals at 3 weeks. Proteins were normalized to luciferase protein levels to control for possible differences in tumor burden. Differences were statistically significant (using Student’s T-Test) for Twist1 (n=15 tumors for vehicle and n=20 tumors for harmine), P < 0.04 and c-PARP (n=9 tumors for vehicle and n=12 tumors for harmine), P < 0.005 respectively.

