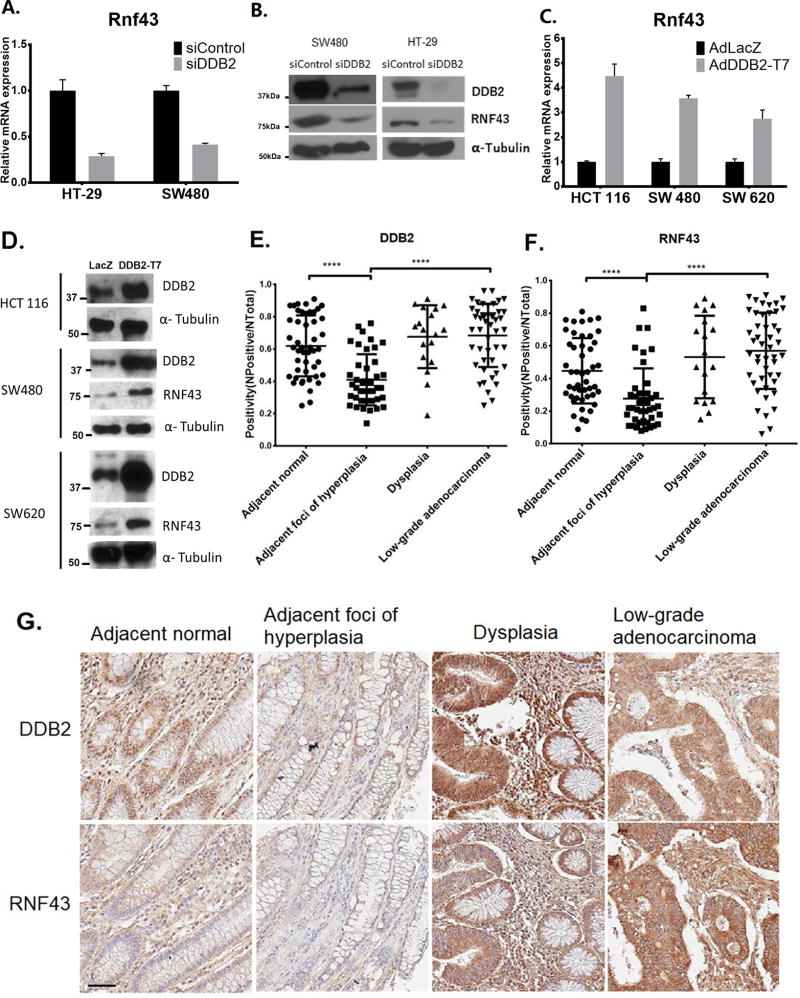
Figure 1. Expression of Rnf43 in colon cancer cells and in human colonic tissues correlates with DDB2.
(A) SW480 cells and HT-29 cells were transient transfected with siRNAs (siControl or siDDB2). Total RNA was analyzed using qRT-PCR for the mRNA level of Rnf43 N=3, Error bars indicate SD. (B) Total levels of DDB2, RNF43 and α-Tubulin (Loading Control) proteins were analyzed by Western Blotting. (C and D) The indicated cell lines were infected with adenovirus expressing either LacZ or T7 tagged DDB2 (T7-DDB2). qRT-PCR (C) was performed to analyze relative mRNA level of Rnf43expression (Normalized by gapdh). N=3, Error bars indicate SD. Western blotting (D) was performed to analyze the protein levels of DDB2, RNF43 and α-Tubulin. (E and F) Immunohistochemical staining of RNF43 and DDB2 in adjacent normal, adjacent foci of hyperplasia, dysplasia and low-grade adenocarcinoma samples were quantified as positivity (=Number of Positive/Number of Total). Positivity of DDB2 (E) and RNF43 (F) were plotted. N of Adjacent normal = 47, N of Adjacent foci of hyperplasia= 42, N of Dysplasia = 18, N of Low-grade adenocarcinoma = 47. **** P < 0.0001 (G) Representative images of DDB2 expression and RNF43 expression from same patient. Scale bar =50 µm.

