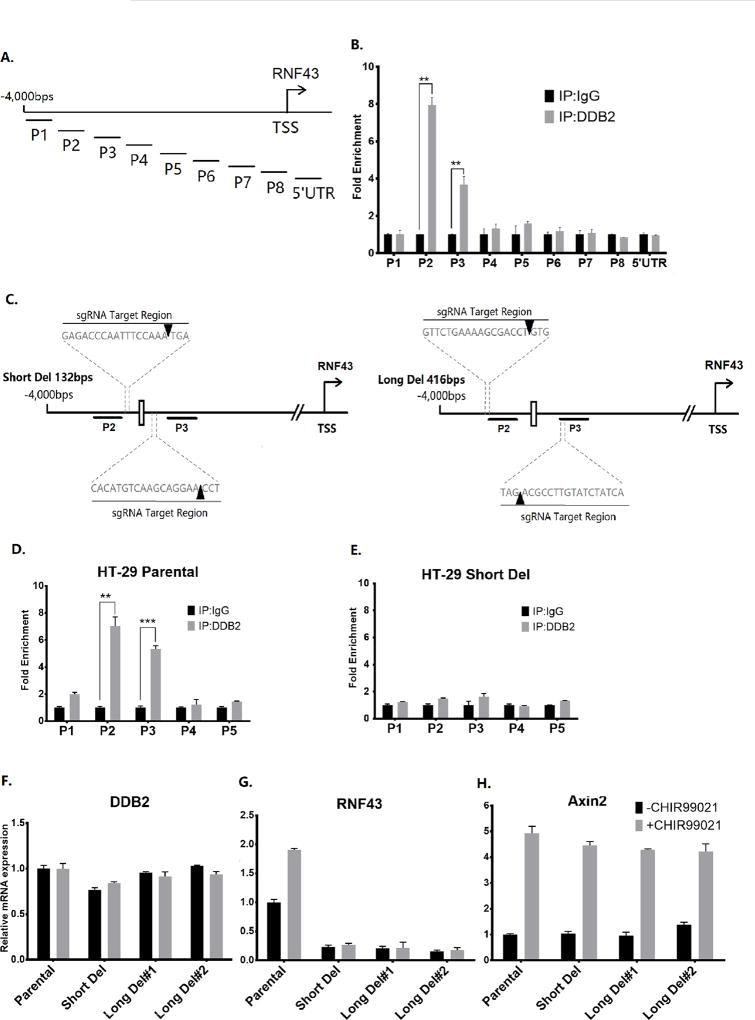
Figure 2. DDB2 binds to an upstream region in the Rnf43 gene and deletion of DDB2 binding region inhibits Rnf43 expression.
(A) The schematic representation of the human Rnf43upstream regulatory region. The thick truncated lines mark the regions covered by primer sets of interest. TSS: Transcription start site. (B) Chromatin-IP (ChIP) assays for binding of DDB2 with regulatory region upstream of the Rnf43gene. The ChIP assay was conducted to analyze the local enrichment of DDB2 across the upstream regulatory region and part of 5’ UTR of Rnf43gene in HCT 116 cells. The relative fold enrichment was quantified by normalization to input. And the fold enrichment of IgG is set as 1 for all primer sets. N = 5, Error bars indicate SD. **: P <0.01. (C) The schematic representation of the human Rnf43upstream regulatory region. The thick truncated lines mark the P2 and P3 regions. The white rectangle between P2 and P3 regions indicates the putative DDB2 binding element ‘TCCCCTAA’. Dash lines indicate location of the sequences targeted by sgRNAs used in CRISPR/Cas9 genome editing. The orange arrowheads indicate the precise region where the Cas9 Nuclease cuts the genomic sequence. (D and E) ChIP assay was performed to analyze the local enrichment of DDB2 in HT-29 Parental cells (D) and Short Del cells (E). The relative fold enrichment was quantified by normalization to input. And the fold enrichment of IgG is set as 1 for all primer sets. (F–H) Parental HT-29 cells, Short Del HT-29 cells and two clones of Long Del HT-29 cells were treated with DMSO or CHIR99021 (6.7µM, 24 hrs). The mRNA levels of DDB2 (F), Rnf43 (G) and Axin2 (H) were analyzed using qRT-PCR (Normalized by 18S rRNA). N = 3, Error bars indicate SD. **: P <0.01. ***: P <0.001

