
Figure 5. Shannon entropy as an index to compare treatment strategies.
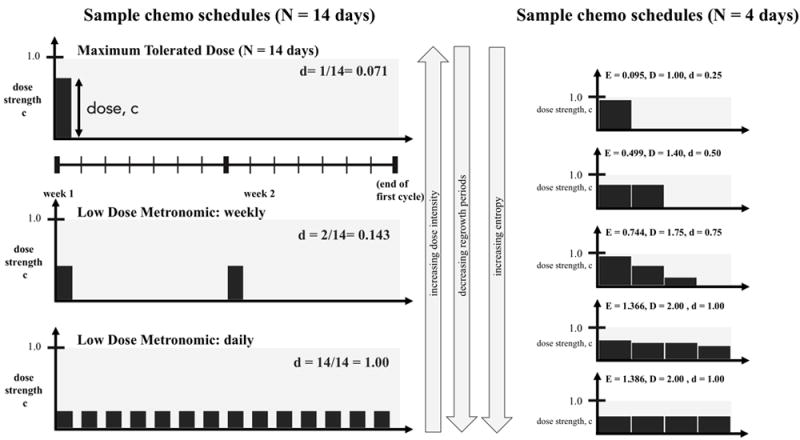
(Left:) 3 common chemotherapy schedules are shown for one cycle (N = 14 days). Maximum Tolerated Dose (left, top) is a high dose (administered once at the beginning of every 2 week cycle) and low dose density (d = 0.071, see equation 16) regimen. Low Dose Metronomic Weekly (left, middle) is a lower dose, higher density (d = 0.143) regimen, while Low Dose Metronomic Daily is the lowest dose, highest density (d = 1.00). (Right:) Similarly, chemotherapy regimens can be simulated for a range of dose, density, and entropy values. Pictured from top to bottom are a range of representative regimens from low entropy (i.e. high dose, low density) to high entropy (i.e. low dose, high density) for a cycle of N = 4 days. On each ith day, treatment of dose ci is administered. The treatment strategy’s Shannon Entropy, E, is calculated according to equation 14 and the total dose delivered is calculated according to equation 15. All treatment strategies are front loaded (monotonically decreasing) regimens. It should be noted that LDM-like regimens correspond to a high entropy value (bottom, left and right).