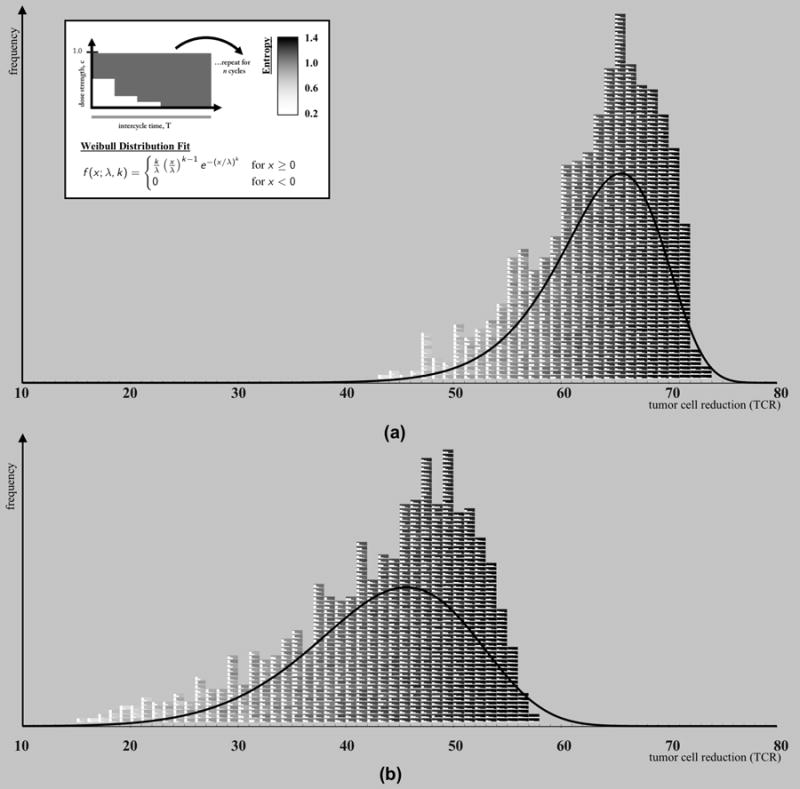
Figure 6. High entropy, LDM-like chemotherapies outperform low entropy MTD-like chemotherapies.

Two pictorial histograms are plotted where each block (color-coded from white: low entropy to black: high entropy) represents a chemotherapy regimen. (a) A slow-growing tumor (w = 0.1) (b) A fast-growing tumor (w = 0.2). All regimens are equivalent total dose (D = 0.3), monotonically decreasing, and are repeated for 8 cycles of chemotherapy and the tumor cell reduction (TCR) is recorded. The dose density, d, and dose concentration, ci, are varied between regimens. The histogram clearly shows a color-shift from white toward black for low TCR, ineffective therapies toward high TCR, effective therapies. High entropy (black) therapies outperform low entropy therapies. The data was fit to a Weibull distribution (shown in upper left panel; (a): k = 14.251, λ = 65.882, (b): k = 6.647, λ = 46.758), overlaid in a solid line.
