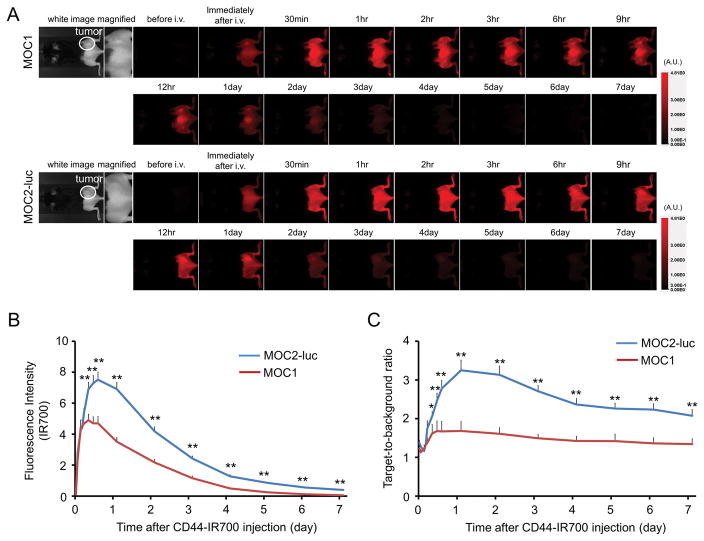
Figure 2. In vivo IR700 fluorescence imaging of MOC1 and MOC2-luc tumor.
(A) In vivo anti-CD44-IR700 fluorescence real-time imaging of tumor-bearing mice (right dorsum). The tumor showed high fluorescence intensity after injection and the intensity was gradually decreased over days. (B) Quantitative analysis of IR700 intensities in both tumors (n = 10). The IR700 fluorescence intensity of both tumors shows high intensities within 1 day after APC injection but this decreased gradually over days. The overall IR700 intensity over time was significantly higher in MOC2-luc tumors compared with MOC1 tumors at most time points (**p < 0.01, by Mann-Whitney test). (C) Quantitative analysis of TBR in both tumors (n = 10). TBR was high 1 day after APC injection, following which the TBR gradually decreased over the following days in both tumors. TBRs of MOC2-luc tumors were significantly higher than MOC1 tumors at most time points (*p < 0.05, **p < 0.01, by Mann-Whitney test).

