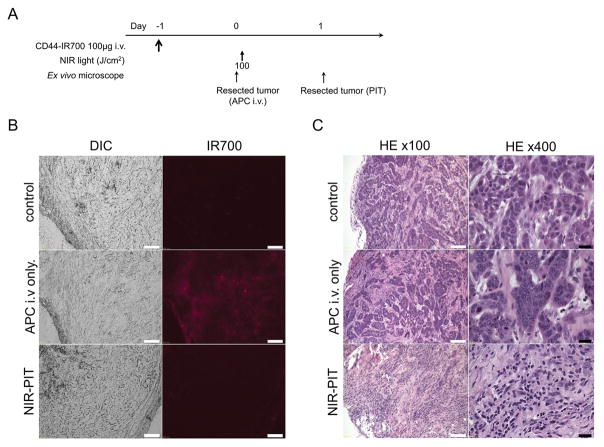
Figure 4. In vivo histological fluorescence distribution and histological NIR-PIT effect for MOC1 tumor.
(A) The regimen of NIR-PIT. (B) Differential interference contrast (DIC) and fluorescence microscopy images of MOC1 tumor xenografts. Fluorescence intensity is shown in MOC1 cells 24 h after injection of anti-CD44-IR700, but the fluorescence disappears 24 h after 100 J/cm2 of NIR-PIT. Scale bars = 100 μm. (C) Resected tumors were stained with H&E. A few scattered clusters of damaged tumor cells are seen within a background of diffuse cellular necrosis and micro-hemorrhage after NIR-PIT, while no obvious damage was observed after anti-CD44-IR700 alone without NIR light. White scale bars = 100 μm. Black scale bars = 20 μm.

