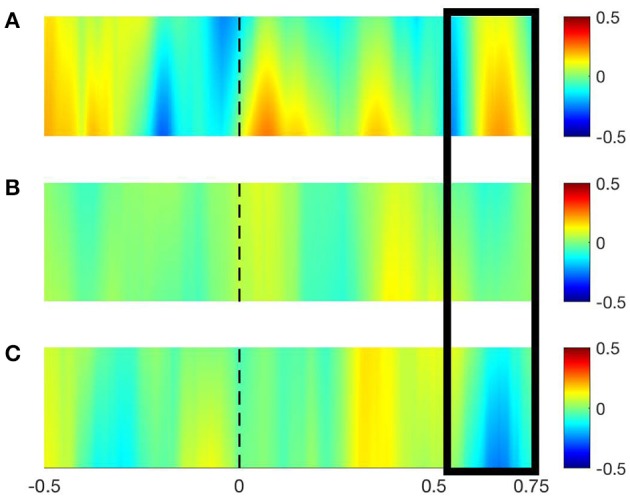
Figure 3.

EEG time-Frequency plots (TFRs) for the game level AS1 (A), AS2 (B), and SEL2 (C) representing the evoked (log-transformed) power (range depicted in the right sided legend). TFRs are shown here for the sensor Fp1 over the left prefrontal cortex in the time interval [−0.5, 0.75 s] and in the theta frequency band [range (3.5–7.5 Hz) after applying a 2 Hz smoothing on the 5.5 Hz frequency], as the channel-frequency-time combination was significant. The dotted black line indicates the stimulus onset and the black rectangle represents the time range [~0.25, ~0.75 s] a priori selected where the significant changes in evoked power occurred over the three game levels.
