FIGURE 8.

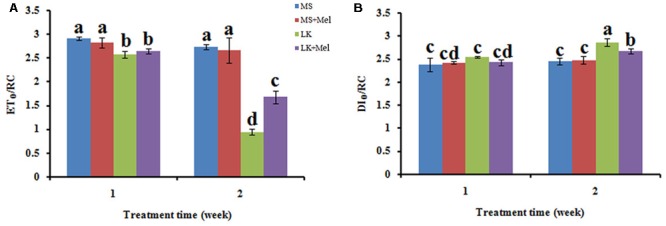
Changes of specific energy fluxes per active PSII reaction center (RC) as deduced by JIP-test analysis of fluorescence transients. (A) ETO/RC, electron transport flux (further than QA-) per RC; (B) DIO/RC, energy fluxes for dissipation.

Changes of specific energy fluxes per active PSII reaction center (RC) as deduced by JIP-test analysis of fluorescence transients. (A) ETO/RC, electron transport flux (further than QA-) per RC; (B) DIO/RC, energy fluxes for dissipation.