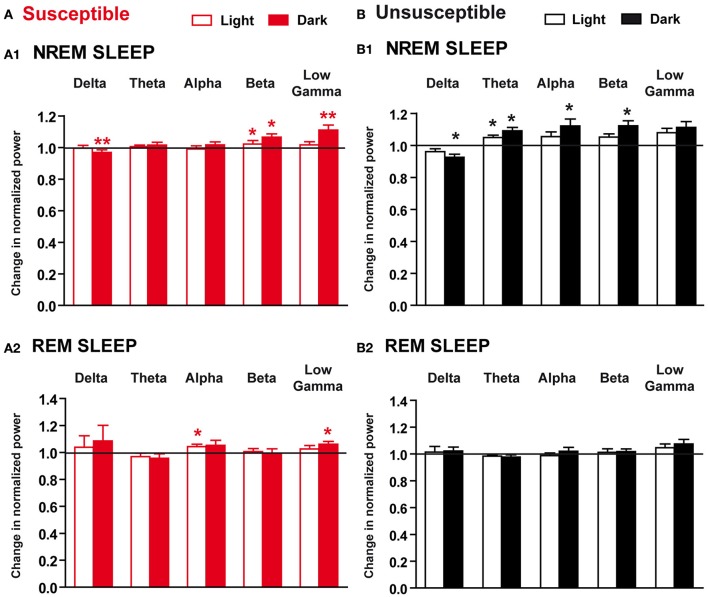
Figure 6.
Long-term effects of the chronic social defeat stress on EEG power spectra within NREM sleep and REM sleep in susceptible and unsusceptible mice. Changes in normalized EEG power spectrum on recovery day 5 (R5) compared to BL in susceptible (A) and unsusceptible (B) mice during NREM sleep (A1,B1) and REM sleep (A2,B2). For each time window tested (12-h of the light and 12-h of the dark periods), changes in normalized EEG power in each power band (delta: 0.5–4.99 Hz, theta: 5–9.9 Hz, alpha: 10–12.99 Hz, beta: 13–29.99 Hz, and low gamma: 30–50 Hz) were expressed as a ratio of individual relative values obtained on each SD session over BL. For each mouse, relative values were obtained by dividing each power band over the sum of all values from 0.5–50 Hz. All data are means ± SEM of eight susceptible and seven unsusceptible mice. Statistical analysis was performed on relative EEG power in each power band. *P < 0.05, **P < 0.01, significantly different from the control conditions (BL); Wilcoxon's or Student's paired t-tests (see Table S1).

