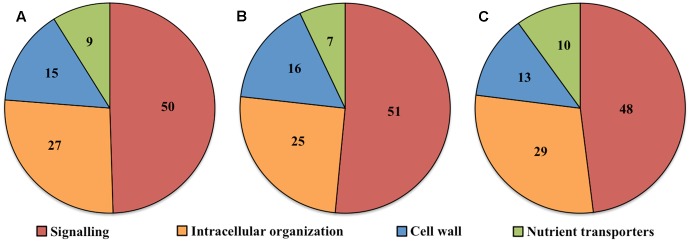
FIGURE 2.
Pie charts showing the proportion (%) of (A) total, (B) up-regulated and (C) down-regulated ETC-specific DEGs in each key TC functional category (signaling, intracellular organization, cell wall, nutrient transporters) during wall labyrinth construction. DEGs in each functional category were classified based on their annotation in Mapman Mercator and KEGG functional analysis (see Supplementary Table S7).

