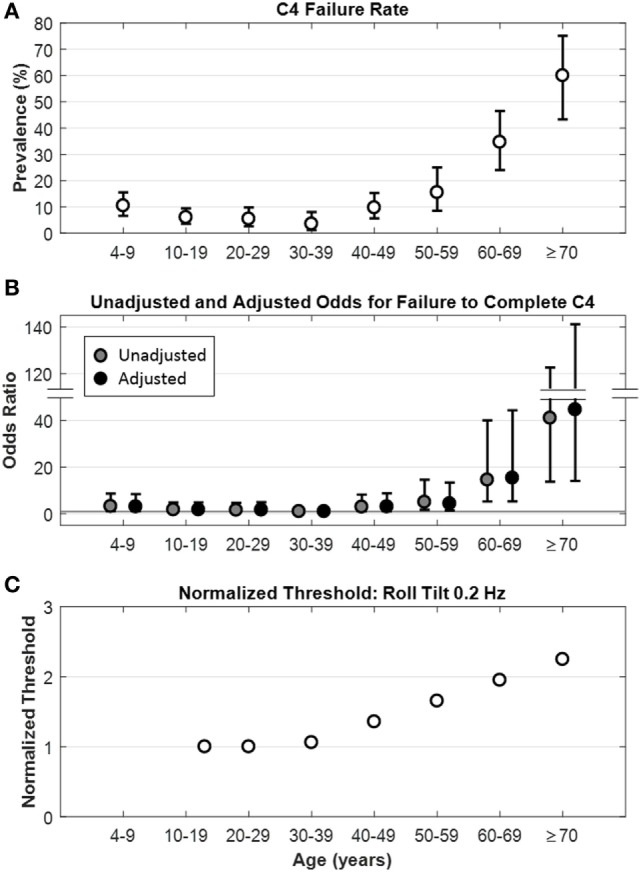
Figure 1.

Relationship between age and C4 failure. (A) Rate of C4 failure as a function of age (p < 0.0001), whiskers show ±95% confidence intervals. (B) Unadjusted ( ) and adjusted (●) odds ratios for failure to complete C4 by age. Whiskers show ±95% confidence intervals. Gray horizontal line is the line of null effect. Odds ratios were adjusted for sex, age, race, ethnicity, and history of diabetes and hypertension. (C) Model fit for roll tilt 0.2 Hz thresholds as a function of age in healthy participants, from Bermúdez Rey et al. (12).
