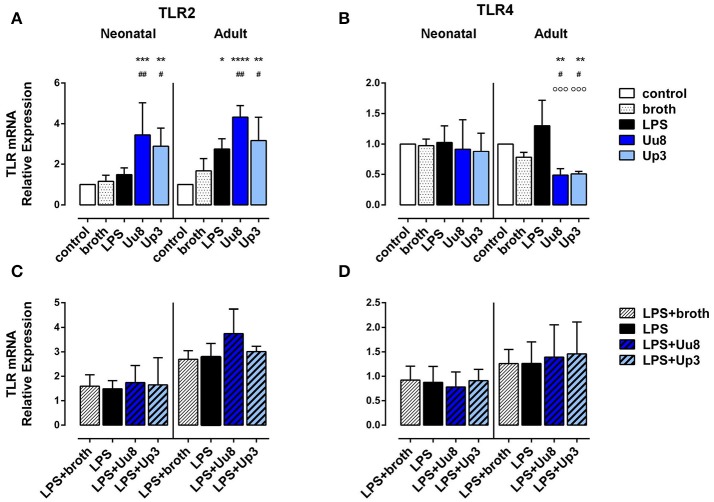
Figure 5.
Expression of TLR2 and TLR4 mRNA in Ureaplasma-stimulated term neonatal and adult monocytes. Relative quantification is presented as mean ± SD in monocytes exposed to Uu8 and Up3 (A,B) and in monocytes co-stimulated with Ureaplasma isolates and LPS (C,D) (*p < 0.05, **p < 0.01, ***p < 0.001, ****p < 0.0001, vs. unstimulated control; #p < 0.05, ##p < 0.01, vs. broth control; °°°p < 0.001, vs. LPS-activated monocytes).

