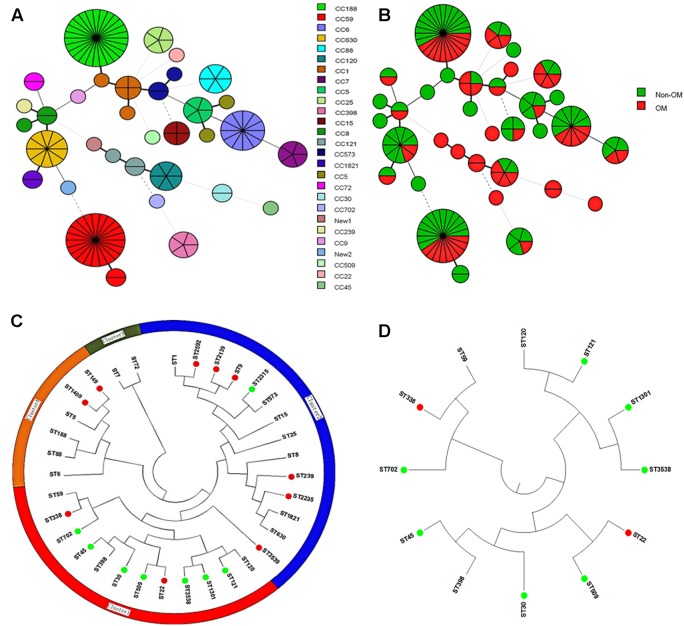
FIGURE 1.
BioNumerics visualization and phylogenetic analysis of sequence types (STs). (A,B) STs stratified by clonal complexes (CCs) and OM/non-OM group were visually presented using BioNumerics. (C) Phylogenetic analysis of all the identified STs. All the STs were mainly divided into four clusters. (Green dot indicates STs specific to OM group; red dot indicates STs specific to non-OM group). Almost all the STs specific to OM were grouped to cluster 1. (D) Subtree of cluster 1 is shown separately.

