FIGURE 4.

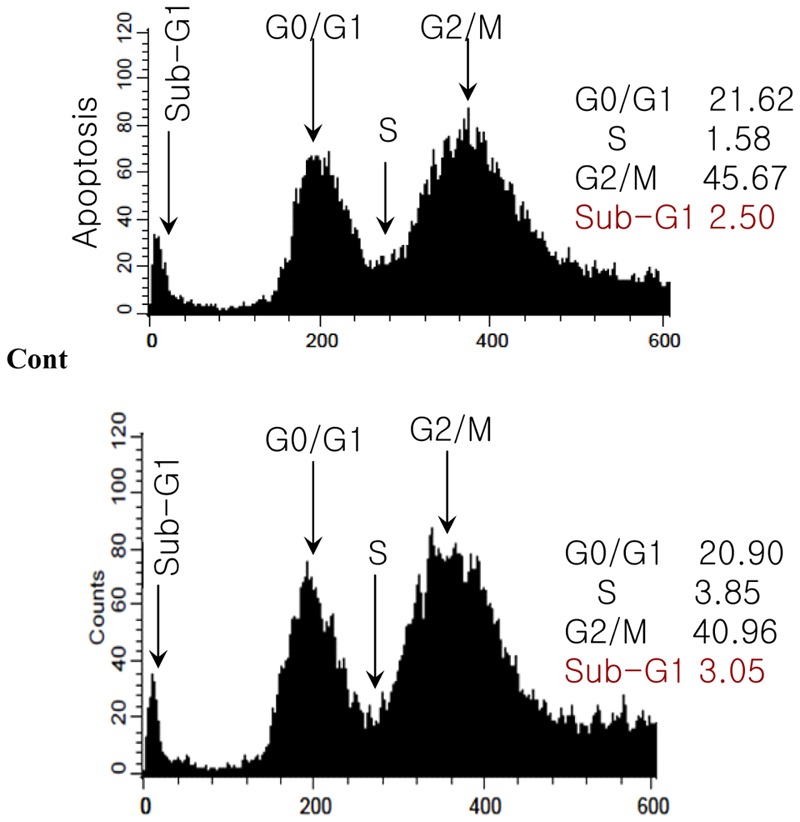
Cell cycle distribution of HepG2 cells as influenced by MEDr. The cells were incubated for 24 h in medium alone (control) or with MEDr (500 μg/ml). The cells were stained with PI solution and analyzed for DNA content by flow cytometery.

Cell cycle distribution of HepG2 cells as influenced by MEDr. The cells were incubated for 24 h in medium alone (control) or with MEDr (500 μg/ml). The cells were stained with PI solution and analyzed for DNA content by flow cytometery.