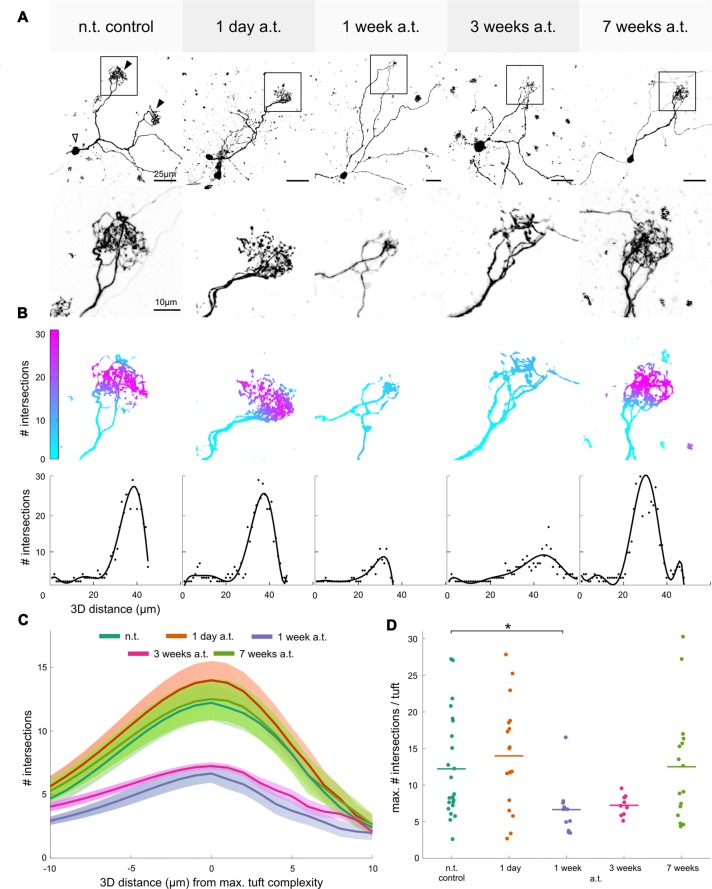
Figure 5.
Dynamic changes of mitral/tufted cell dendritic tuft complexity in the OB after olfactory nerve transection. (A) Top row shows individual MTCs stained via sparse cell electroporation. Maximum intensity projections of image stacks of representative MTCs are shown for each time-point after ON transection. Animals were transected unilaterally and MTCs were stained and analyzed on both the non-transected side of the OB, used as control, and on the transected side, 1, 3 and 7 weeks a.t. Bottom row shows a magnification of the tufted regions (boxed outline). (B) Top row illustrates quantification of complexity of the tufts shown in (A) using Sholl analysis. The number of intersections on the three-dimensional tuft is represented as a color gradient on the tuft morphology—blue areas indicate very few intersections and magenta indicates many intersections. Bottom row shows linear Sholl plots for each of the presented tufts with number of intersections indicated as dots and best fit polynomial function as line. (C) The average linear tuft-complexity curves (of all curves as shown in B) for tufts of each respective group are shown. A distance of ±10 μm around the maximum is shown. The shaded areas around the curves indicate the SEM within each group. (D) Scatter plot showing the maximum number of intersections for each tuft analyzed in the control group and at each respective time point a.t. Lines show the mean of all analyzed tufts for each time-point. a.t., after transection; MTC, mitral/tufted cell; n.t., non-transected; OB, olfactory bulb; ON, olfactory nerve. Statistical significance was tested using Kruskal-Wallis test followed by Dunn’s multiple comparison post hoc test with Holm-Bonferroni correction (*p < 0.05).

