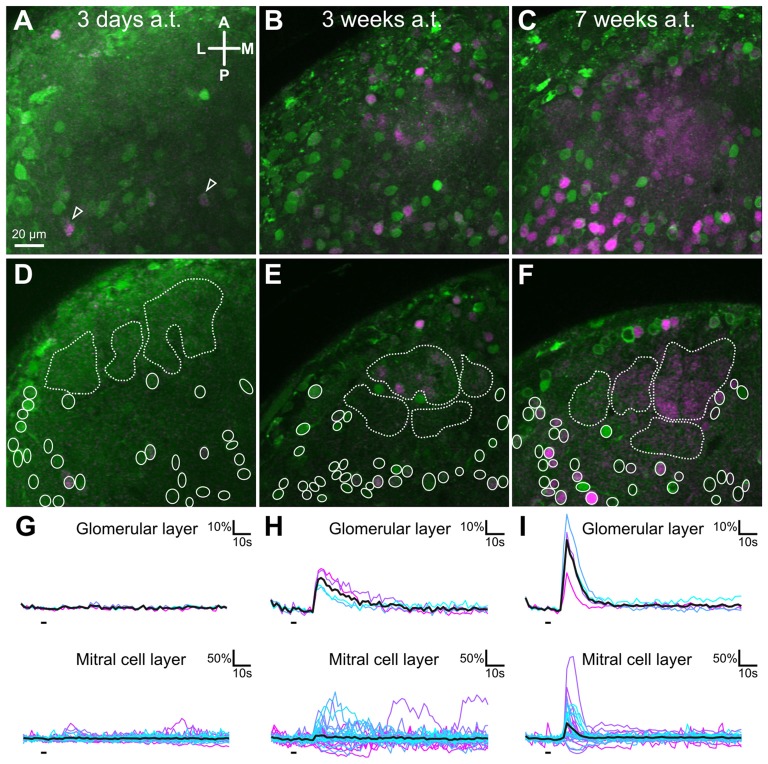
Figure 6.
Functional changes in mitral/tufted cell and glomerular layer of the lateral glomerular cluster of the OB after olfactory nerve transection. Maximum projections of representative examples of imaged volumes in the ventro-lateral OB of different whole olfactory system explants measured 3 days (A), 3 weeks (B) or 7 weeks (C) post-transection. MTC somata and their tufts were labeled by calcium indicator injection (green) and responses to odorant stimulation of the olfactory organ were recorded. Regions that showed a time-correlated response to stimulation of the MOE with an amino acid mixture are shown in magenta (Difference image of peak response minus pre-stimulus activity). Single planes of the imaged volumes measured 3 days (D), 3 weeks (E) or 7 weeks (F) after ON transection. Dashed white lines surround regions of interest in the glomerular layer, while white ellipses indicate MTC somata. (G–I) Calcium transients of neuropil and individual cells (different shades of blue and magenta, shown as ∆F/F values) are derived from the regions of interests highlighted in the respective images above. The mean response of all regions of interest in the glomerular neuropil and mitral cell layer are depicted as black traces. Some cells with occasional, spontaneous, time-correlated activity were visible (also highlighted with open arrowheads). A, anterior; a.t., after transection; L, lateral; M, medial; MOE, main olfactory epithelium; MTC, mitral/tufted cell; OB, olfactory bulb; ON, olfactory nerve; P, posterior.

