Figure 4.

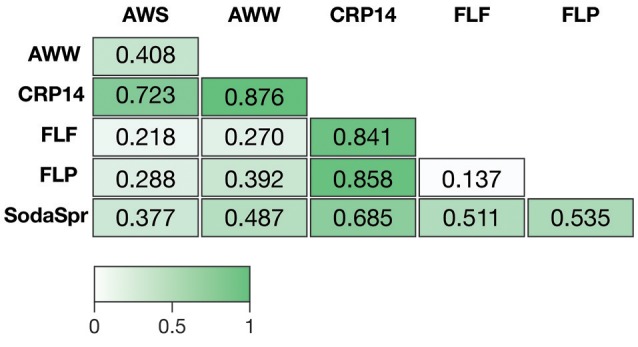
Analysis of similarity (ANOSIM) R-values showing differences in microbial community composition between each of the six substrate arrays. The value of p for all comparisons was <0.0001%.

Analysis of similarity (ANOSIM) R-values showing differences in microbial community composition between each of the six substrate arrays. The value of p for all comparisons was <0.0001%.