
FIGURE 2.
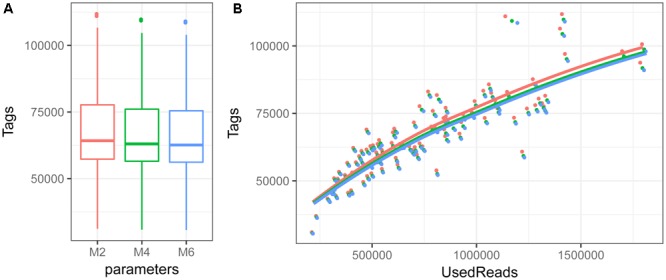
Boxplot depicting first and third quartile, median and standard deviation of number of RAD-tags per individual (A) and relationship among number of RAD-tags and used reads (B) when the M parameter is set to 2 (red), 4 (green) or 6 (blue).
Official websites use .gov
A
.gov website belongs to an official
government organization in the United States.
Secure .gov websites use HTTPS
A lock (
) or https:// means you've safely
connected to the .gov website. Share sensitive
information only on official, secure websites.
Boxplot depicting first and third quartile, median and standard deviation of number of RAD-tags per individual (A) and relationship among number of RAD-tags and used reads (B) when the M parameter is set to 2 (red), 4 (green) or 6 (blue).