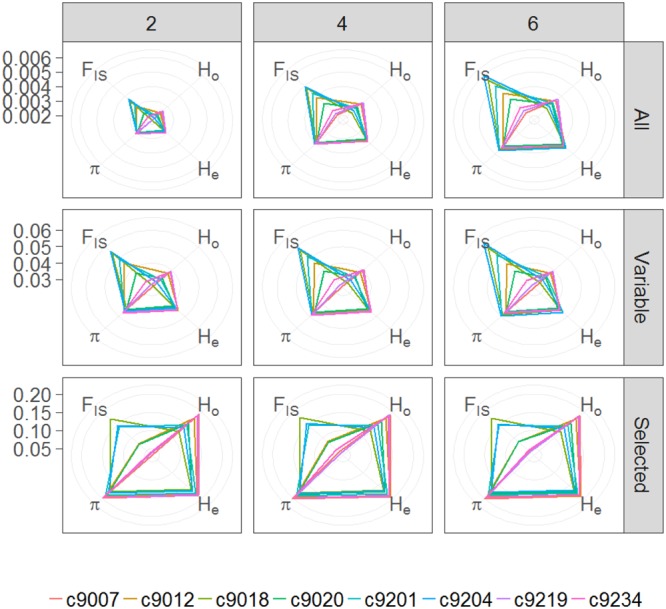
FIGURE 3.

Radar plots showing average nucleotide diversity (π), inbreeding coefficient (FIS), and expected (He) and observed (Ho) heterozygosity for each catch (colored lines) considering each value of M (2, 4, or 6) and for either, all positions included in tags present in at least 75% of the individuals (All), only variable positions within these tags (Variable) or only selected SNPs (Selected).
