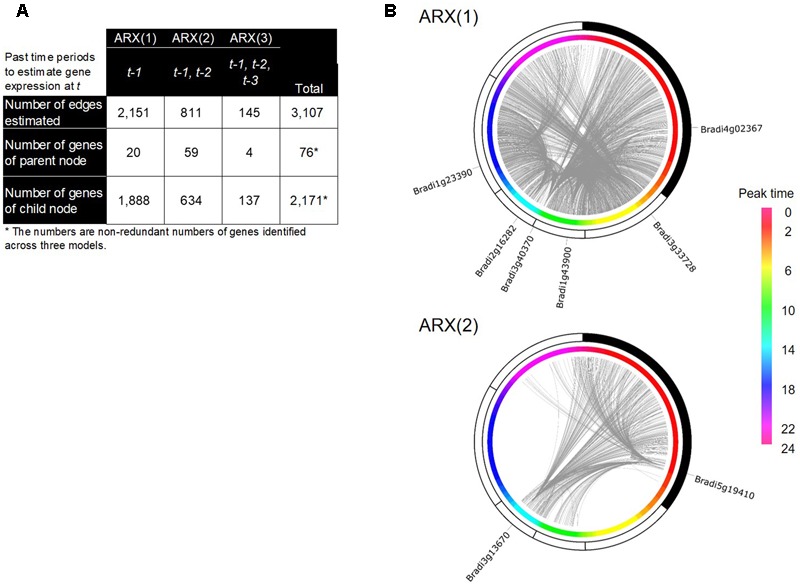
FIGURE 5.

A gene regulatory network (GRN) inferred by the group SCAD method in B. distachyon. (A) Summarized network structure of the group SCAD networks based on the ARX(1), ARX(2), and ARX(3) models. (B) Circular representations of the group SCAD networks with the rhythmic genes and their expression peak time from ARX(1) and ARX(2) models. The nodes of the rhythmic genes are sorted based on their peak time of gene expression. The gray lines represent edges of the networks. Identifiers of genes with more than 50 output edges are shown.
