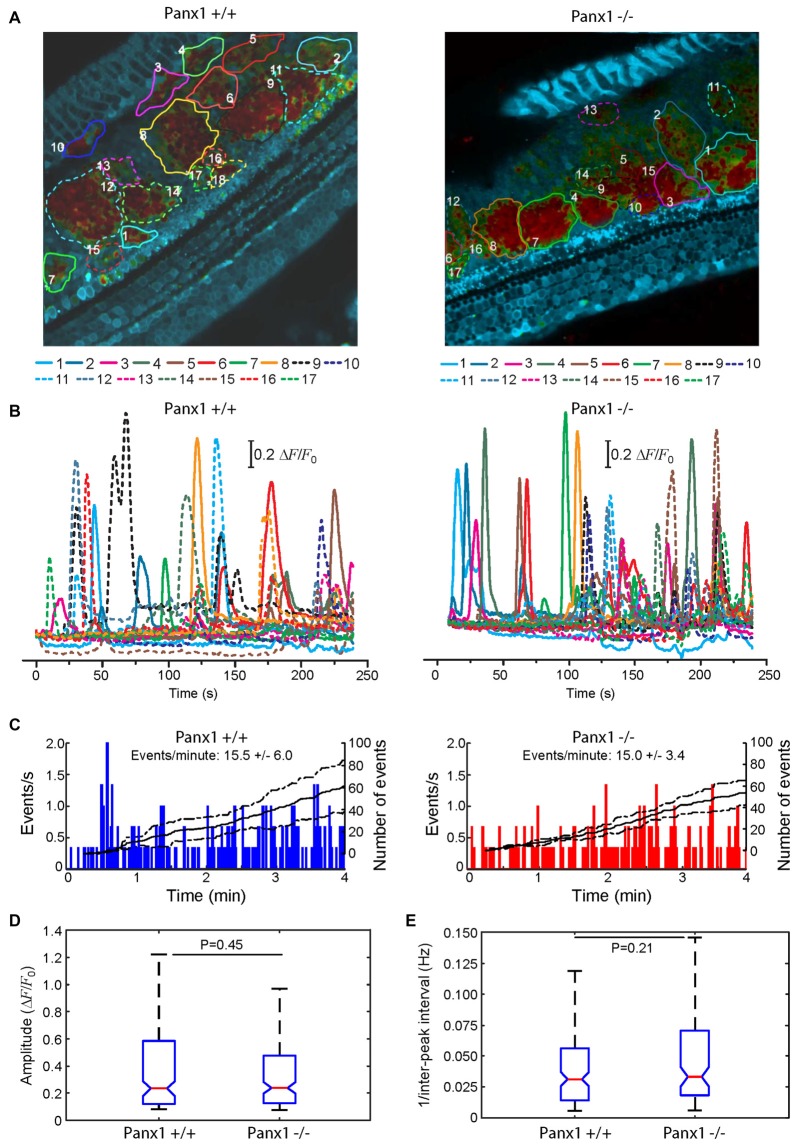
Figure 10.
Spontaneous cytosolic Ca2+ transients in the GER of WT (Panx+/+) and Panx1−/− postnatal cochlear cultures. (A) Representative false-color images of Fluo-Forte fluorescence changes (ΔF/F0), encoded as shown by the color scale bar, obtained as maximal projection rendering of all frames recorded in an apical-middle turn culture from a P5 mouse imaged for 4 min at 5 frames per second; regions of interests are shown superimposed on different GER areas invaded by spontaneous Ca2+ waves. Scale bar, 50 μm. (B) Fluo-forte traces generated as pixel averages from the color-matched regions of interests shown in (A). (C) Frequency histograms of spontaneous cytosolic Ca2+ transients (events) in cultures from P5 Panx+/+ and Panx1−/− mice (pooled data). (D) Distributions of events amplitude (ΔFmax/F0), from data in (C). The values of the median and inter-quartile range (IQR) are, respectively: 0.2340 and 0.4641 (Panx+/+); 0.2398 and 0.3501 (Panx1−/−). (E) Distributions of the frequency (i.e., the reciprocal of the inter-peak interval) between consecutive events from data in (C). The values of the median and IQR are, respectively (in Hz): 0.0312 and 0.0420 (Panx+/+); 0.0331 and 0.0520 (Panx1−/−). P-values in (C,D) were computed with the Mann-Whitney U test.

