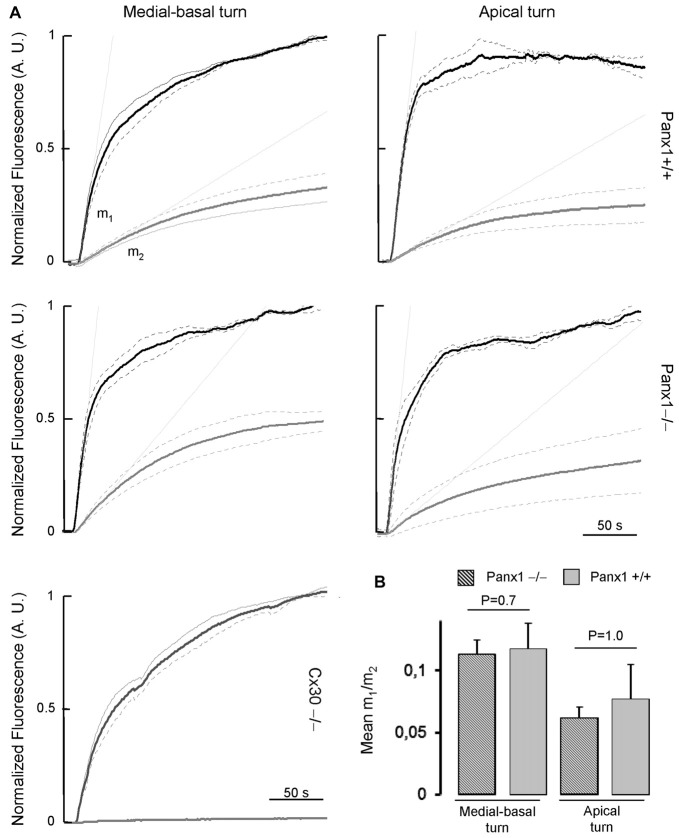
Figure 9.
(A) Lucifer yellow fluorescence emission averaged over the cell body of (first order) cells (gray solid lines, n = 5) adjacent to the injected cell and normalized to the maximal fluorescence emission detected in the injected cell (black solid lines); data are mean values ± SEM (dot lines) for n = 8 cells in each condition. (B) For each experiment, the interpolating line of the curve related to first order cells (with computed slope m2) and to the injected cell (with computed slope m1) was computed over the first 10 s of recording. Histograms show mean values of the ratio between m2 and m1 for WT (Panx+/+, dashed bars) and Panx1−/− mice (filled bars). Error bars represent SEM.

