FIGURE 3.

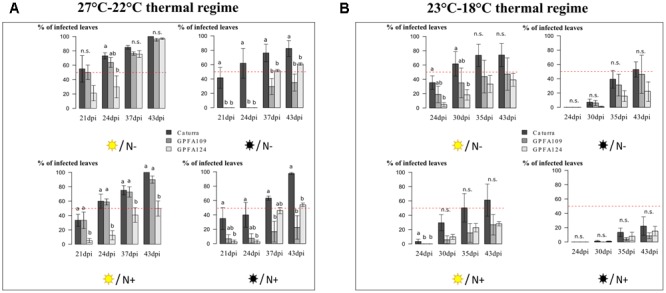
Variations in the percentage of leaves infected by H. vastatrix during the time course of the infection under different combinations of light intensity and nitrogen fertilization in three different genotypes. (A) The 27°C–22°C thermal regime. (B) The 23°C–18°C thermal regime. For each thermal regime, four treatments were studied  /N-
/N-  /N-
/N-  /N+
/N+  /N+ corresponding respectively to high light intensity (1000 PAR)/low nitrogen fertilization, low light intensity (300 PAR)/low nitrogen fertilization, high light intensity (1000 PAR)/ high nitrogen fertilization, low light intensity (300 PAR)/high nitrogen fertilization. The inbred line Caturra and the two hybrids GPFA109 and GPFA124 are respectively in black, dark gray and light gray. The red dotted line represents 50% of infected leaves. The data are means of the percentage of infected leaves ± SD (n = 4). Different letters denote significant differences between the genotypes within each treatment according to Tukey’s test (P < 0.05). ns, non-significant differences.
