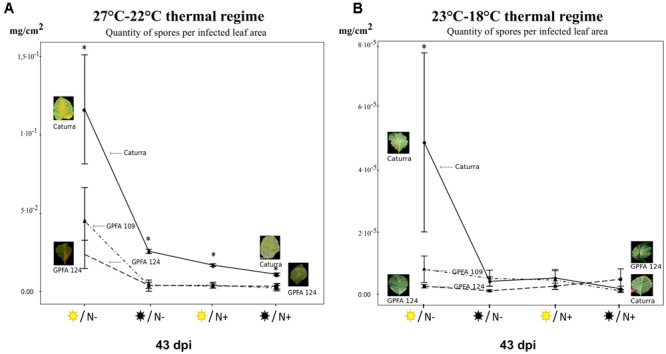
FIGURE 4.

Quantity of spores per infected leaf area (also named ‘sporulation’) produced by H. vastatrix under different combinations of light intensity and nitrogen fertilization in three different genotypes. (A) The 27°C–22°C thermal regime. (B) The 23°C–18°C thermal regime. NB: The scale of the two graphs is different. For each thermal regime, four treatments were studied  /N-
/N-  /N-
/N-  /N+
/N+  /N+ corresponding respectively to high light intensity (1000 PAR)/low nitrogen fertilization, low light intensity (300 PAR)/low nitrogen fertilization, high light intensity (1000 PAR)/high nitrogen fertilization, low light intensity (300 PAR)/high nitrogen fertilization. Circles represent the inbred line Caturra, triangles the hybrid GPFA109 and squares GPFA124. The data are means of the spores weight harvested on the coffee plant 43 days post inoculation per infected leaf area ±SD (n = 4). Within each treatment, means for a genotype followed by an asterisk are significantly different according to Tukey’s test (P < 0.05).
