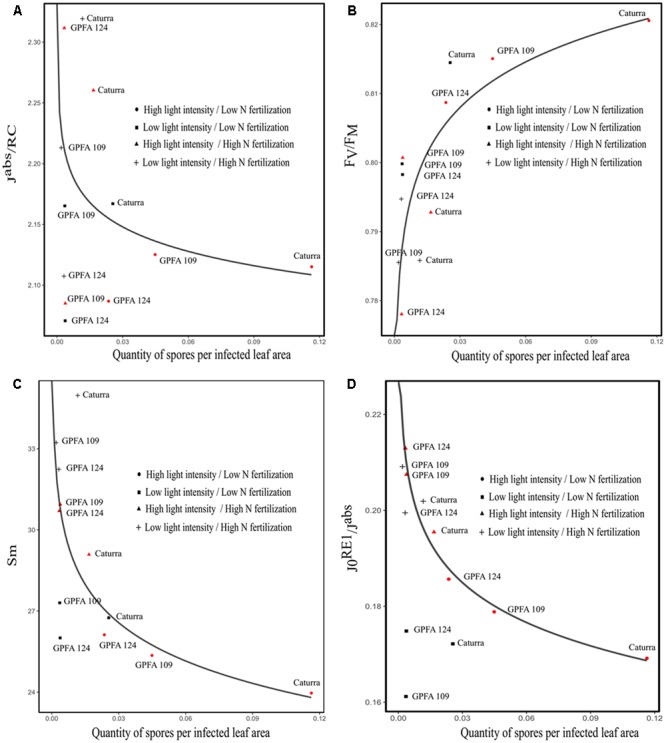
FIGURE 5.

Correlation between parameters derived from Chlorophyll a fluorescence induction curve and the quantity of spores harvested on three Coffea arabica genotypes grown with different combinations of light intensity and nitrogen fertilization under TR (27–22°C). (A) The rate of photon absorption per PSII (Jabs/RC). The points corresponding to light treatment (in red) were fitted by the equation y = -0.07∗log(x) +2.05; residual standard error: 0.091. (B) The maximum quantum yield of primary photochemistry (FV/FM). The points corresponding to light treatment (in red) were fitted by the equation y = 0.02∗log(x) +0.84; residual standard error: 0.009. (C) The normalized area proportional to the number of electron carriers per electron transport chain. The points corresponding to light treatment (in red) were fitted by the equation y = -4.7∗log(x) +19; residual standard error: 0.08. (D) The quantum yield of the electron transport flux until the PSI electron acceptors (J0RE1/Jabs). The points corresponding to light treatment (in red) were fitted by the equation y = -0.03∗log(x) + 0.14; residual standard error: 0.003.
